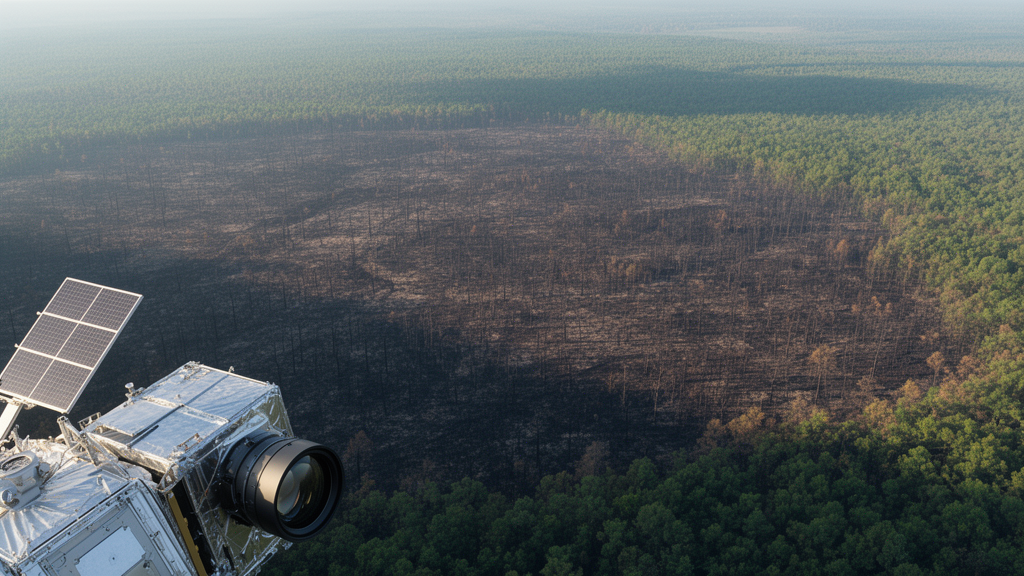
When a large wildfire finally subsides, land managers face a race against the clock. Flood and debris-flow modeling, stabilization of hillslopes and channels, revegetation, salvage logging, and risk mitigation for homes and communities all depend on burn-severity maps that show where fire effects on vegetation and soils were most intense. Yet the satellite observations used to build those maps are frequently delayed or blocked by smoke, clouds, and snow. A new open-access study published in Fire Ecology on 2 October 2026 quantifies exactly how much those atmospheric obstacles matter, and evaluates how quickly and accurately four freely available satellite datasets can deliver usable post-fire imagery across North America.
The research team, led by K. C. Rodman with a large group of coauthors from the United States and Canada, analyzed 9,129 large fires of at least 404 hectares that burned in Canada and the United States between 2016 and 2024. The datasets compared were Landsat, the long-standing workhorse of operational burn-severity mapping; Sentinel-2, a European multispectral mission; Sentinel-1, a C-band synthetic aperture radar, or SAR, satellite; and the Harmonized Landsat Sentinel-2 product, known as HLS, which merges imagery from Landsat and Sentinel-2 onto a common 30-meter grid with consistent geometric, radiometric, and atmospheric correction. All datasets were analyzed at 30-meter resolution within Google Earth Engine.
The study pursued three objectives. First, the researchers quantified how often aerosols, clouds, and snow or ice obstructed Earth observations after large fires, using daily MODIS and VIIRS satellite products. Aerosol obstruction was flagged when aerosol optical depth at blue wavelengths reached 0.5 or higher, a common threshold for heavy loading; cloud obstruction came from quality flags marking probably cloudy, confidently cloudy, or cloud-shadowed pixels; and snow obstruction was flagged whenever any snow cover was present. Second, they measured observational latency, defined as the number of days between a fire’s end date and the first usable scene, meaning an image with at least 80 percent of the fire perimeter free of clouds, cloud shadows, snow or ice, or heavy aerosol loading. Third, on a subset of 77 fires in forested ecosystems, they tested how well burn-severity maps from each dataset matched field measurements collected between zero and three years after fire.
The obstruction results were striking. Cloud cover was by far the dominant limitation for multispectral imagery: 47.3 percent of large fires experienced heavy cloud obstruction, meaning clouds blocked more than half of the days, during the first month after the fire. This burden fell hardest on Alaska, coastal Canada, and the southeastern United States, while the western US remained relatively clear. By contrast, aerosol obstruction was rare, affecting only 2.7 percent of fires with heavy post-fire aerosol cover, mainly in the Boreal Shield and Hudson Bay regions of eastern Canada. Snow heavily obstructed just 3.0 percent of fires, but those cases clustered in the Sierra Nevada, North Cascades, and Canadian Rocky Mountains, where winter and spring snowfall often follows the fire season. Because SAR actively transmits and receives microwave energy that penetrates most atmospheric conditions, Sentinel-1 can observe burned areas regardless of cloud cover or smoke.
Two case studies illustrate the range of conditions mapmakers encounter. The 2020 Bush Fire in Arizona burned for roughly a week in June, and during the first month after it ended no days were heavily obstructed by aerosols or snow, with clouds blocking only 17.2 percent of days, so usable imagery arrived quickly. The 2020 Cameron Peak Fire in Colorado was a different story: it ignited in August, was not fully contained until December, and burned at high elevations into winter. Snow heavily obstructed 55.2 percent of days in the first post-fire month and clouds another 34.5 percent. Although Sentinel-1 delivered a usable image immediately after fire activity subsided, Landsat, Sentinel-2, and HLS provided no unobstructed scene for more than six months.
Across all 9,129 fires, the latency rankings were clear. Median time to the first usable scene was 4 days for Sentinel-1, 7 days for HLS, 10 days for Sentinel-2, and 17 days for Landsat. Most fires had at least one usable scene within the first post-fire month, ranging from 68.6 percent of fires for Landsat to 89.2 percent for Sentinel-1. One-month composite images, which combine all unobstructed pixels from all scenes acquired in the first month, achieved near-complete coverage, defined as more than 99 percent of the fire area, for 89.6 percent of fires with Sentinel-1 and 82.8 percent with HLS, substantially better than Sentinel-2 at 70.5 percent and Landsat at 56.1 percent. Despite its widespread operational use, Landsat provided the slowest and least complete early post-fire coverage of the four datasets.
Latency also shifted over time as satellite fleets changed. Sentinel-1 and Sentinel-2 latencies dropped substantially in 2017 and 2018 after the launches of Sentinel-1B and Sentinel-2B, Landsat latency improved after Landsat 9 launched in 2021, and Sentinel-1 latency rose modestly after Sentinel-1B failed in December 2021. The researchers formally compared sensors using generalized linear mixed models that accounted for spatial dependence among fires nested within ecoregions and for variation across fire years, and the sensor differences held even when early years of the Sentinel program were excluded.
Timeliness alone is not enough, however, so the team validated the satellite indices against field data: the Composite Burn Index, which summarizes soil, vegetation, and fuel changes on a scale from 0 to 3, along with basal area loss and tree mortality, drawn from 2,714 unique field plots across the 77 forested fires. Multispectral burn severity was estimated with the relativized burn ratio, which contrasts near-infrared and shortwave-infrared reflectance between pre- and post-fire imagery and corrects for pre-fire vegetation differences. Sentinel-1 used the normalized radar burn ratio, built on fire-induced changes in radar backscatter. The validation showed that HLS, Landsat, and Sentinel-2 corresponded well with field measurements, while Sentinel-1 was consistently less accurate, though its performance improved over time and matched the multispectral sensors only during winter months.
Critically, all three multispectral datasets reliably identified areas of near-total canopy loss, classified as a Composite Burn Index of at least 2.25 or basal area loss or tree mortality of at least 95 percent, using imagery acquired within two months after fire, exceeding 80 percent balanced accuracy. That early performance came close to extended assessments built from a full post-fire growing season of imagery, the traditional benchmark method. Predictions of the Composite Burn Index were generally less accurate than predictions of basal area loss or tree mortality, suggesting that fire effects on trees are easier to capture remotely than effects on soils and understory vegetation. Field plots measured two to three years after fire showed higher severity at the same satellite index value, consistent with delayed tree mortality that early imagery cannot fully register.
The authors conclude that HLS offers the best combination of latency, spatial coverage, and burn-severity mapping performance, making it a strong candidate for operational use and ecological monitoring, even though it is not yet widely used for burn-severity mapping. Sentinel-1 remains valuable where persistent cloud cover limits optical observations, including eastern Canada and the Pacific Northwest, and hybrid approaches that use SAR to fill gaps in obstructed multispectral imagery could improve both timeliness and accuracy. The study has limits: validation relied on forested ecosystems and may not extend to grasslands, field data lacked direct measures of soil effects such as water repellency or ash cover, and field measurements collected up to three years after fire introduce ecological variability. Still, as fire seasons lengthen and smoke increasingly travels far downwind, choosing the right satellite data source, and combining sensors wisely, may determine how quickly communities at risk from post-fire flooding and erosion get the maps they need.
Subject of Research: Evaluating the timing, data obstruction, and accuracy of four satellite datasets for post-fire burn-severity mapping across Canada and the United States.
Article Title: Right on time: evaluating accuracy and timing of burn-severity assessments to support post-fire management
Article References: Rodman, K. C., Whitman, E., Howe, A. A., Spannuth, A., Barrett, K. J., Beinhart, C. A., Boucher, Y., Busby, S. U., Carrasco, J. T., Clark-Wolf, K. D., Corbett, M. J., Crouse, J. E., Danneyrolles, V., Dappen, P. R., Davis, K. T., Harvey, B. J., Holden, Z. A., Hood, S. M., Iniguez, J. M., … Yocom, L. L. (2026). Right on time: evaluating accuracy and timing of burn-severity assessments to support post-fire management. Fire Ecology, 22(1), Article 154. https://doi.org/10.1186/s42408-026-00589-y
Image Credits: AI Generated
DOI: 10.1186/s42408-026-00589-y
Keywords: burn severity, wildfire, remote sensing, Landsat, Sentinel-1, Sentinel-2, HLS, synthetic aperture radar, cloud cover, post-fire management, satellite imagery, fire ecology
Cite Scienmag News
Drew Townsend. (October 29, 2026). Faster Radar or Sharper Optics: Rethinking Satellite Burn-Severity Mapping. Scienmag. https://scienmag.com/faster-radar-or-sharper-optics-rethinking-satellite-burn-severity-mapping/
Drew Townsend. "Faster Radar or Sharper Optics: Rethinking Satellite Burn-Severity Mapping." Scienmag, 29 October 2026, https://scienmag.com/faster-radar-or-sharper-optics-rethinking-satellite-burn-severity-mapping/. Accessed 29 October 2026.
Drew Townsend. "Faster Radar or Sharper Optics: Rethinking Satellite Burn-Severity Mapping." Scienmag. October 29, 2026. https://scienmag.com/faster-radar-or-sharper-optics-rethinking-satellite-burn-severity-mapping/