


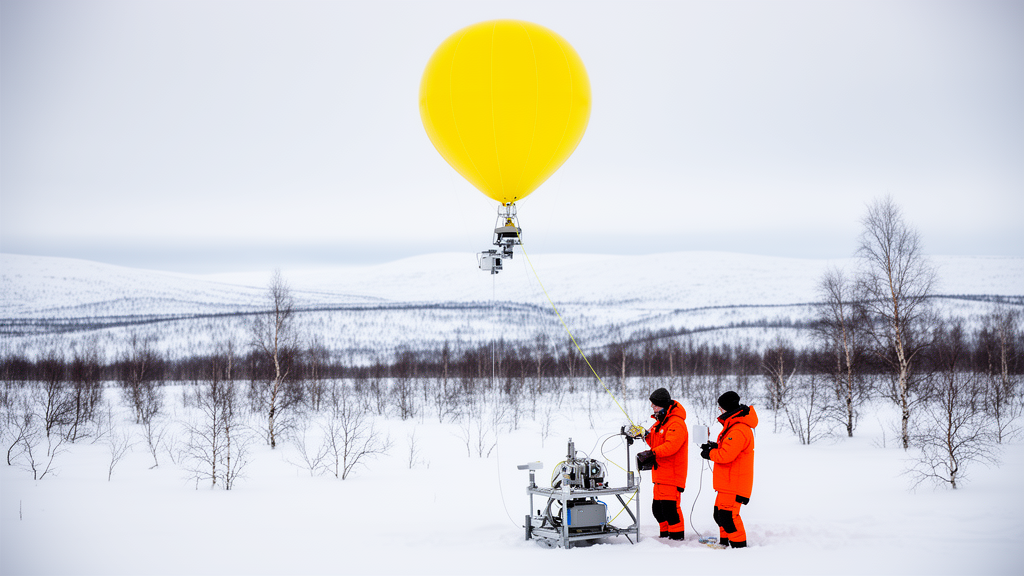
High above the grassy shoreline of lake Pallasjärvi in Finnish Lapland, roughly 160 kilometres north of the Arctic Circle, a helium-filled balloon-kite hybrid spent eight flights in late September 2022 drifting through some of the most poorly observed clouds on Earth. The instrument hanging from its tether, the Advanced Max Planck CloudKite instrument, or MPCK+, has now yielded a peer-reviewed dataset published in Earth System Science Data that documents turbulence, wind shear and cloud microphysics in the sub-arctic boundary layer from the surface up to about 1200 metres. For atmospheric scientists trying to understand how warm clouds make rain, the release of this openly available archive is a significant moment.
The Pallas Cloud Experiment, PaCE for short, ran from mid-September to mid-December 2022 and was organised by the Finnish Meteorological Institute around the Pallas-Sodankylä Global Atmospheric Watch Sammaltunturi station. Research teams from the Max Planck Institute for Dynamics and Self-Organization in Göttingen, ETH Lausanne, the Karlsruhe Institute of Technology, the University of Hertfordshire and the Vienna University of Technology deployed fixed-wing and multi-copter drones, tethered balloons, mountain-top and ground stations and remote sensing instruments to characterise aerosols and clouds in a single vertical column at high resolution. The newly published MPCK+ dataset covers the intensive period from 19 to 26 September 2022, when the balloon-borne payload flew eight missions totalling 19 hours and 37 minutes of flight time.
The choice of a tethered balloon rather than a research aircraft is central to what makes these measurements special. Research aircraft typically push through clouds at 50 to 150 metres per second, which blurs the fine structure of droplet fields and introduces artefacts such as adiabatic heating of inlets and the shattering of droplets or ice crystals on sensor surfaces. The MPCK platform moves with the wind itself, at air speeds on the order of 5 to 10 metres per second, improving spatial resolution by a factor of 5 to 30. It can also fly at low altitude over complex terrain in conditions that would be too risky for pilots. During the campaign, winds never exceeded 20 metres per second, comfortably below the platform’s recommended maximum of 25.
The platform itself is a Helikite, a balloon-kite combination whose keel and sail hold it at a stable 45-degree angle to the vertical even in gusty conditions, unlike an ordinary balloon that gets pushed toward the ground. During most PaCE 2022 flights the team operated a tandem configuration, pairing a 250 cubic metre Helikite as the lower balloon with a 34 cubic metre Helikite above it. This arrangement increased static lift by 10 percent and made take-off and landing of the large balloon considerably safer in gusty winds. The combined lift was sufficient to carry a 100-kilogram payload to altitudes beyond 1200 metres above ground, with altitude controlled by a motorised winch reeling the main tether in and out.
The MPCK+ payload integrates nine devices into one scientific unit. A one-dimensional pitot static system measures air speed, barometric altitude and temperature; an inertial navigation system records position, orientation, velocity, angular velocity and acceleration; a humidity and temperature sensor unit pairs an AM2315 sensor with a nearby Vaisala HMP7; a backup GNSS receiver and a thermal anemometry unit complete the core. Cloud droplet size and concentration in one dimension come from a Fast Cloud Droplet Probe manufactured by SPEC Inc. Two in-house-built imaging modules, a digital inline holography unit for three-dimensional particle position, size and shape and a Particle Imaging Velocimetry unit for stream-wise and vertical particle velocity, share a partially overlapping sample volume. Every fifth hologram, recorded at 75 hertz, has a corresponding PIV image pair at exactly the same time, allowing in-situ inter-instrument calibration as droplets are detected by both instruments in the overlapping volume.
The spatial resolution is remarkable: with low air speeds and high image acquisition rates, successive holograms are separated by only about 5 to 6 centimetres, and droplet size distribution samples are spaced less than 10 metres apart. The instrument software can even use droplets detected by the Fast Cloud Droplet Probe above a given size and concentration threshold to automatically trigger the holography and PIV units. Although the imaging data are not part of the published dataset, the flight table documents their availability, and the published NetCDF files include a carefully curated set of core variables with calibration polynomials already applied.
The eight flights sampled a striking variety of conditions. The first flight, on 19 September, encountered broken cumulus and stratocumulus under northerly winds but suffered a power supply fault that left visible gaps in the record; the problem was fixed and never recurred. Flights on 21 and 23 September stayed below cloud base, with the 21 September flight recording the strongest temperature inversion of the campaign, an almost isothermal layer from the ground to 800 metres above sea level capped by an inversion between 800 and 900 metres. Aerosol particles detected below that inversion never reached the free atmosphere above. On 26 September the story changed dramatically: during the midday flight, low overcast cumulus with drizzle and south-easterly wind kept the instrument inside cloud for most of the flight, and the Fast Cloud Droplet Probe recorded a bimodal droplet size distribution with a primary mode near 5 micrometres and a secondary mode around 20 to 25 micrometres, plus a strong signal of particles larger than 40 micrometres, the seeds of drizzle formed by collision and coalescence.
That same 26 September flight produced the campaign’s largest set of high-quality holograms, covering almost nine minutes of flight time. A single hologram from this series reveals the three-dimensional positions of individual droplets, colour-coded by diameter, allowing researchers to examine droplet clustering, vortices and other phenomena invisible to one-dimensional probes. The holographic droplet size distribution peaks near 20 micrometres with a secondary maximum around 40 micrometres, in good agreement with the probe data. Because the holography unit’s effective pixel pitch is 3 micrometres, droplets smaller than about 6 micrometres cannot be distinguished from background noise, which explains why the probe’s 5-micrometre mode is absent from the holographic record. For larger droplets, the holographic sample volume of 8.6 cubic centimetres, roughly six times larger than the probe’s, yields statistically more robust size distributions.
The team was candid about the dataset’s limitations, which is precisely what makes it usable. The pitot-static temperature sensor reads about 3.5 kelvin too warm compared with the two humidity-temperature units, so the authors recommend the unheated rht sensor for temperature and the corrected rht data group for humidity and dew point. Air speed measured at the pitot tube was corrected to the undisturbed free-stream value using wind tunnel calibration factors, and a further correction applies at the droplet probe’s sample volume. During two flights the dew point derived from combined sensors exceeded the air temperature by about half a kelvin, an unphysical result traced to systematic bias under near-saturated conditions. Water clogging the pitot tubing corrupted air speed readings at certain times, and such events must be identified manually. A Python code sample accompanying the data walks users through the corrections needed to compute droplet concentrations.
The dataset is archived on Zenodo under a dedicated PaCE 2022 community with individual DOIs for each file, in NetCDF format with 50 file-level attributes and a structured hierarchy of device subgroups. The authors intend it for atmospheric scientists studying boundary-layer turbulence and cloud-turbulence interactions, and they recommend combining it with the simultaneous WinDarts and ground weather station datasets published separately in the same special issue. As climate models still struggle to represent how shallow warm clouds form droplets large enough to rain out, high-resolution observations from a sub-arctic site above freezing temperatures offer exactly the kind of ground truth that model developers need. The Pallas dataset, gathered by a kite-balloon dangling quietly beneath a giant helium bubble, may prove one of the most quietly influential contributions to cloud physics this decade.
Subject of Research: Airborne turbulence and cloud microphysics measurements from the Pallas Cloud Experiment 2022 using the tethered Max Planck CloudKite platform
Article Title: Airborne measurements of turbulence and cloud microphysics during PaCE 2022 using the Advanced Max Planck CloudKite Instrument (MPCK+)
Article References: Schlenczek, O., Nordsiek, F., Brunner, C. E., Chávez-Medina, V., Thiede, B., Bodenschatz, E., & Bagheri, G. (2026). Airborne measurements of turbulence and cloud microphysics during PaCE 2022 using the Advanced Max Planck CloudKite Instrument (MPCK + ). Earth System Science Data, 18(10), 7557-7574. https://doi.org/10.5194/essd-18-7557-2026
Image Credits: AI Generated
DOI: 10.5194/essd-18-7557-2026
Keywords: cloud microphysics, turbulence, tethered balloon, Pallas Cloud Experiment, boundary layer, stratocumulus, cumulus clouds, holography, particle imaging velocimetry, droplet size distribution, Finnish Lapland, open data
Cite Scienmag News
Russell Cooper. (October 16, 2026). Tethered Balloon Flights Over Finnish Lapland Capture Cloud Droplets and Turbulence in Unprecedented Detail. Scienmag. https://scienmag.com/tethered-balloon-flights-over-finnish-lapland-capture-cloud-droplets-and-turbulence-in-unprecedented-detail/
Russell Cooper. "Tethered Balloon Flights Over Finnish Lapland Capture Cloud Droplets and Turbulence in Unprecedented Detail." Scienmag, 16 October 2026, https://scienmag.com/tethered-balloon-flights-over-finnish-lapland-capture-cloud-droplets-and-turbulence-in-unprecedented-detail/. Accessed 16 October 2026.
Russell Cooper. "Tethered Balloon Flights Over Finnish Lapland Capture Cloud Droplets and Turbulence in Unprecedented Detail." Scienmag. October 16, 2026. https://scienmag.com/tethered-balloon-flights-over-finnish-lapland-capture-cloud-droplets-and-turbulence-in-unprecedented-detail/


