


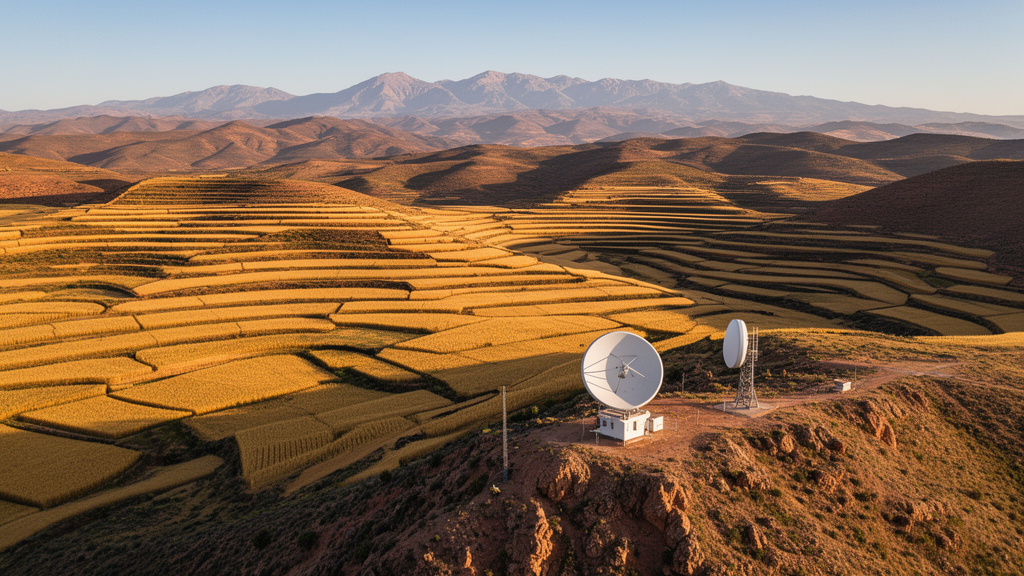
Deep in the Rif Mountains of northern Morocco, where cereal fields cling to steep slopes and olive groves dot the hillsides, a team of researchers has cracked a puzzle that has long frustrated agricultural scientists: how to reliably tell rainfed cereals apart from perennial olive groves using nothing but satellite data. The answer, published in Frontiers in Remote Sensing, is a surprising one. It turns out that the most powerful predictors are not the spectral signatures of the crops themselves but something far more fundamental—the elevation and slope of the terrain where they grow.
The study, led by Meryem Qacami of Laval University in Quebec together with Marc-André Bourgault and Mohamed Chikhaoui, focused on the Tangier–Tétouan–Al Hoceima region, a Mediterranean mountain environment covering 17,262 square kilometers. This is one of the wettest parts of Morocco, often receiving more than 1,000 millimeters of rain annually, yet its agriculture remains almost entirely rainfed. Fields are small, fragmented, and scattered across terrain that ranges from coastal lowlands to peaks exceeding 2,000 meters. Under these conditions, the same crop can look spectrally different depending on where it sits in the landscape, making traditional crop classification approaches unreliable.
To tackle this challenge, the researchers turned to the European Space Agency’s Sentinel-1 and Sentinel-2 satellites, two of the most powerful Earth observation platforms currently in orbit. Sentinel-2 captures optical imagery in visible, near-infrared, red-edge, and shortwave-infrared bands at resolutions of 10 and 20 meters, providing direct insight into vegetation vigor, chlorophyll content, and phenological dynamics. Sentinel-1, by contrast, is a synthetic aperture radar that operates in the C-band, sending microwave pulses toward the ground and measuring the energy that bounces back. Because radar penetrates clouds and works day and night, it offers information on canopy structure, surface roughness, and soil moisture that optical sensors simply cannot access. The team combined these observations with topographic variables—elevation, slope, and aspect—derived from the 30-meter SRTM digital elevation model.
All data processing was carried out in Google Earth Engine, a cloud-based geospatial platform that allowed the researchers to handle the massive volumes of satellite imagery involved. Sentinel-2 scenes were filtered to retain only those with cloud cover below 20 percent, with clouds, cirrus, and cloud shadows removed using the Scene Classification Layer. The remaining observations were aggregated into monthly median composites from January to June 2024, capturing the full growing season. Sentinel-1 data, acquired in descending orbit with approximately 12-day revisit intervals, underwent speckle filtering using a Lee sigma filter, radiometric terrain normalization, and conversion to decibel units. From the dual-polarization VV and VH backscatter measurements, the team derived additional radar features including the difference, ratio, and radar vegetation index.
Phenological analysis played a crucial role in defining the classification window. The researchers reconstructed the NDVI time series using the Dynamic Harmonic Regression model and the Savitzky-Golay smoothing algorithm, achieving a root mean square error of 0.0544 and a correlation coefficient of 0.8865 with the Savitzky-Golay method. This revealed that the growing season in the region extends from early January, when vegetation activity begins, through late March, when biomass peaks, to early June, when senescence completes the crop cycle. This window defined the period during which crop separability was expected to be highest and guided the extraction of all satellite variables used in the classification.
For the classification itself, the team employed a Random Forest classifier implemented in Python using the scikit-learn library with 100 trees. They evaluated 31 predefined feature combinations organized into three categories: Sentinel-2-based scenarios, Sentinel-1-based scenarios, and integrated scenarios combining both sensors. The reference dataset contained 1,300 cereal samples and 750 olive samples, collected through field surveys and cross-checked against very high-resolution imagery in Google Earth. A stratified random sampling approach divided the data into 70 percent for training and 30 percent for validation, with the validation subset completely withheld during model selection.
The results revealed a clear hierarchy among data sources. Sentinel-2 spectral bands alone achieved an overall accuracy of 0.82, which improved to 0.89 when combined with topographic variables. Adding red-edge indices to this configuration pushed accuracy to 0.94. In contrast, Sentinel-1 radar features alone yielded the lowest performance, with overall accuracies ranging between 0.53 and 0.55 for individual radar metrics. Even when topographic variables were added, radar-only configurations reached only about 0.67. However, the best results came from the full integration of optical, radar, and topographic information. The winning configuration combined Sentinel-2 spectral bands, Sentinel-1 VV and VH backscatter, the Normalized Difference Red Edge Index 2, the VV/VH backscatter ratio, and elevation, slope, and aspect, achieving an overall accuracy of 0.96 with balanced F1-scores of 0.92 for cereals and 0.91 for olives.
Repeated 10-fold cross-validation confirmed that the integrated scenario significantly outperformed both single-sensor approaches in terms of overall accuracy and olive-grove discrimination. For cereals, however, the improvement over the Sentinel-2-based scenario was marginal and not statistically significant, indicating that optical and topographic information alone already provided strong discrimination of this class. The benefit of sensor integration was therefore class-dependent, proving particularly valuable for the more challenging olive-grove classification.
Perhaps the most striking finding came from the SHAP-based interpretation of the model. Using Shapley Additive exPlanations, a game-theoretic approach that assigns each predictor a marginal contribution value, the researchers found that elevation emerged as the single most influential variable, followed by slope. Among spectral features, NDRE2 ranked highest, confirming the discriminative power of red-edge information. Several Sentinel-2 bands, particularly B6, B7, and B8A in the red-edge and near-infrared regions, also contributed substantially. Radar features showed comparatively lower importance, suggesting a limited but complementary role.
The dominance of topographic variables makes profound agronomic sense in this rainfed landscape. Under bour conditions—the Moroccan term for rainfed farming—the same crop type can exhibit highly variable spectral signatures across the landscape because of spatial differences in water stress, phenological timing, and soil moisture, all of which are governed by topography. A cereal field on a north-facing slope at 600 meters may look spectrally different from one on a south-facing slope at 300 meters, despite being the same crop, because rainfall interception, soil moisture retention, and growing season length differ. In such conditions, topographic context provides a more stable discriminant than spectral reflectance alone. The western Rif receives between 500 and over 1,000 millimeters of annual rainfall depending on altitude and exposure, making elevation a key predictor of crop viability. Olive trees, with their deep root systems and tolerance to thin soils, are well adapted to sloping terrain, whereas cereals generally require flatter land and are more sensitive to erosion.
The spectral patterns also differed between the two classes in agronomically meaningful ways. For cereals, the narrow near-infrared band B8A and the shortwave-infrared band B12 ranked highest, reflecting the strong NIR reflectance plateau of dense herbaceous canopies at peak growth and the sensitivity of SWIR to moisture content in both vegetation and soil. For olives, the red-edge bands B6 and B7 ranked higher, consistent with the evergreen, sclerophyllous canopy of olive trees, which maintains relatively stable chlorophyll content year-round with subtle seasonal variations best captured in the red-edge region.
Within the rainfed agricultural classification domain, the final map identified approximately 453,215 hectares as rainfed cereals and 23,428 hectares as olive groves, corresponding to 95.1 percent and 4.9 percent of the total mapped area. The largest cereal areas occurred in Chefchaouen province, followed by Larache, Al Hoceima, Ouazzane, and Tétouan. Olive groves showed a more concentrated distribution, with the largest mapped areas in Chefchaouen, Larache, and Tétouan provinces.
The researchers acknowledge several limitations. The analysis focused on a single agricultural season and therefore does not capture interannual variability associated with climate fluctuations or management changes. The use of 10-meter satellite imagery may still be affected by mixed-pixel effects in highly fragmented agricultural areas. Only the Random Forest algorithm was evaluated, although other machine-learning and deep-learning approaches may offer complementary insights. The binary classification task also represents a relatively straightforward discrimination between two structurally and phenologically contrasting categories, and the high accuracy should not be directly generalized to more complex multiclass problems involving several annual crops with overlapping phenological cycles.
Nevertheless, the study demonstrates that accurate mapping of rainfed cereals and olive groves in heterogeneous Mediterranean agro-ecosystems benefits from the integration of spectral, structural, and topographic information. The proposed framework provides a useful foundation for extending crop mapping and agricultural monitoring approaches in data-scarce and climate-sensitive regions, where rainfed agriculture supports the livelihoods of millions and remains highly vulnerable to climatic variability. By linking classification performance with agro-ecological interpretation, the work offers new insights into the environmental and anthropogenic drivers of crop distribution and contributes to the development of more robust agricultural monitoring systems for the world’s most fragile farming landscapes.
Subject of Research: Mapping rainfed cereals and olive groves using Sentinel-1, Sentinel-2, and topographic data in northern Morocco
Article Title: Mapping rainfed cereals and olive groves using Sentinel-1, Sentinel-2, and topographic data in northern Morocco
Article References: Mapping rainfed cereals and olive groves using Sentinel-1, Sentinel-2, and topographic data in northern Morocco. (n.d.). https://doi.org/10.3389/frsen.2026.1880806
Image Credits: AI Generated
DOI: 10.3389/frsen.2026.1880806
Keywords: Mapping, rainfed, cereals, olive, groves, Sentinel-1, Sentinel-2, topographic, data, northern, Morocco, scientific research
Cite Scienmag News
Alan Morgan. (October 16, 2026). Radar, Satellites, and Mountain Slopes: The Surprising Recipe for Mapping Morocco’s Rainfed Farms. Scienmag. https://scienmag.com/radar-satellites-and-mountain-slopes-the-surprising-recipe-for-mapping-moroccos-rainfed-farms/
Alan Morgan. "Radar, Satellites, and Mountain Slopes: The Surprising Recipe for Mapping Morocco’s Rainfed Farms." Scienmag, 16 October 2026, https://scienmag.com/radar-satellites-and-mountain-slopes-the-surprising-recipe-for-mapping-moroccos-rainfed-farms/. Accessed 16 October 2026.
Alan Morgan. "Radar, Satellites, and Mountain Slopes: The Surprising Recipe for Mapping Morocco’s Rainfed Farms." Scienmag. October 16, 2026. https://scienmag.com/radar-satellites-and-mountain-slopes-the-surprising-recipe-for-mapping-moroccos-rainfed-farms/


