Researchers have built a machine learning framework that maps urban flood inundation across the Mumbai Metropolitan Region by combining satellite radar and optical observations with two hydrologically informed predictors designed to capture how terrain and rainfall control flooding. The study, published in Natural Hazards and Earth System Sciences, reports that adding these terrain-conditioned and rainfall-conditioned variables lifted the discrimination of a flood classification model from an area under the receiver operating characteristic curve of roughly 0.66, when only radar-derived predictors were used, to approximately 0.80 with the complete predictor set. The work was carried out by Ankush S. Pawar and Gayatri M. Phade, of the Department of Electronics and Telecommunication at the Sandip Institute of Technology and Research Centre and PVGCOE&SSDIOM in Nashik, India, respectively.
Urban flooding in rapidly urbanizing coastal megacities is difficult to map because of complex terrain, dense populations and scarce reliable ground observations. Mumbai experiences recurrent flooding where intense monsoon rainfall, low-lying topography, inadequate drainage and tidal influences combine, and the city’s mix of rivers, creeks, reclaimed lowlands and heavily built-up space makes it a demanding test case. Conventional hydrodynamic and hydraulic models can estimate flood depth, extent and flow velocity in detail, but the authors note that their high computational demands, extensive parameterization and need for high-resolution spatial data limit their suitability for rapid or near-real-time mapping, especially where data are sparse.
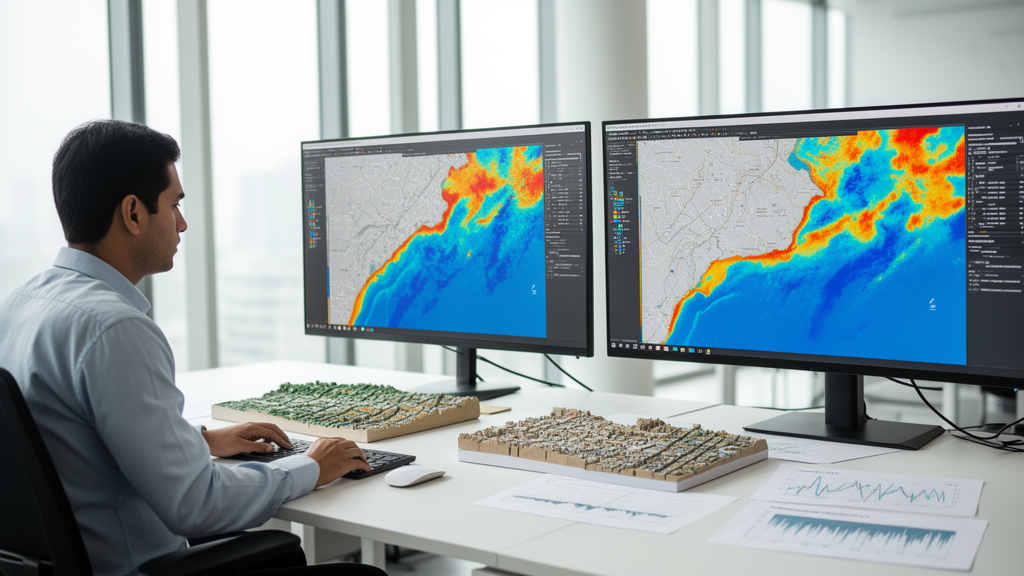
The new framework draws on four freely available data streams processed within the Google Earth Engine cloud platform: Sentinel-1 C-band synthetic aperture radar with VV and VH polarizations, Sentinel-2 optical surface reflectance imagery, the 30-meter Shuttle Radar Topography Mission digital elevation model, and Climate Hazards Group InfraRed Precipitation with Station data rainfall products. Radar images were radiometrically calibrated, terrain-corrected and filtered to reduce speckle, and flood-sensitive features were derived from differences and ratios between pre-event and peak-flood backscatter. From the optical data the team computed spectral indices including NDWI, MNDWI, NDVI and NDBI, which record surface water and land-cover context under cloud-free conditions. Elevation, slope and aspect came from the digital elevation model, while cumulative monsoon rainfall captured spatial precipitation variability.
The central methodological contribution lies in two hydrologically informed predictors. The first is the Relative Elevation Model, or REM, calculated as the difference between the elevation of each pixel and the elevation of the nearest river pixel taken from the HydroRIVERS dataset. Lower REM values indicate poorer gravitational drainage and greater vulnerability to waterlogging during heavy rainfall; the authors describe it as a simplified drainage-referenced elevation difference conceptually related to measures such as Height Above Nearest Drainage. The second is the Rainfall-Normalized Index, or RNI, defined as the Normalized Difference Water Index multiplied by the natural logarithm of cumulative CHIRPS precipitation plus one, a transformation that dampens the influence of extreme rainfall values. Higher RNI values mark places where substantial rainfall coincides with elevated surface wetness or standing water.
To create training labels without field observations, the researchers generated a flood inventory through a multi-sensor consensus rule. A pixel was labeled as flooded if at least two of three indicators agreed: a SAR backscatter difference exceeding 3 decibels, chosen because speckle-related variations are typically around 1 decibel and prior flood mapping studies report good discrimination for changes in the 2 to 5 decibel range; a SAR ratio above 1.25; an optical NDWI above 0.05, a deliberately low threshold intended to detect shallow, turbid urban floodwater that would be missed by the 0.2 to 0.3 thresholds typical for open water; and a topographic criterion of REM below 5 meters, reflecting evidence that low-relief coastal floodplains are especially prone to inundation in that range. The resulting inventory covered approximately 2.6 times ten to the fifth flooded pixels across the Mumbai Metropolitan Region during the 2019 monsoon season.
From this inventory the team drew a balanced stratified sample of about 12,000 points, split equally between flooded and non-flooded classes, standardized the features, imputed missing values with means, and divided the data into 80 percent training and 20 percent testing subsets. Three supervised classifiers were then trained and compared: a Random Forest baseline, an Extreme Gradient Boosting model tuned by grid search, and an ensemble that averaged the probabilities of the two. Performance was assessed with accuracy, precision, recall, F1 score and the area under the ROC curve, and differences between models were tested for statistical significance with the non-parametric DeLong test at the 95 percent confidence level.
The tuned XGBoost model achieved the best results, with an overall accuracy of 71.7 percent and an AUC of 0.803, ahead of Random Forest at 0.796 and the ensemble at 0.794. The authors report that the ensemble offered no statistically significant discriminatory advantage over the single classifiers, with p-values above 0.05, supporting the use of the tuned XGBoost configuration. Ablation experiments quantified the contribution of the hydrologic predictors: removing REM and RNI dropped the XGBoost AUC to 0.77 and accuracy from 0.717 to 0.69, so the two hydrologic-topographic variables contributed an increase of roughly 5 to 6 percent in AUC. Comparing the full model against a SAR-only configuration showed discrimination rising from about 0.66 to about 0.80. DeLong tests gave a p-value of 3.97 times ten to the minus six for the full model versus the configuration without REM, and 2.37 times ten to the minus four against the default predictor set, and effect sizes expressed as Cohen’s d of 15.65 and 5.58 indicated very large practical differences. Five-fold cross-validation yielded a mean AUC of 0.801 with a standard deviation of 0.008, and a sample-size sensitivity analysis showed relatively small variation, which the authors interpret as evidence of stable model behavior.
The spatial patterns produced by the model also appeared hydrologically plausible. Predicted flood probability was highest along major drainage corridors, river-adjacent floodplains and low-lying coastal and riverine areas, particularly near the Mithi River and its associated floodplains, and probability values changed smoothly across heterogeneous urban terrain. DEM profiles of the Mithi, Dahisar and Ulhas river systems showed that documented flood-prone localities such as Kurla, Saki Naka and Vakola fall within the low-REM range used for labeling. A qualitative comparison against flood-prone locations reported by municipal agencies and previous studies found the predicted areas consistent with historically vulnerable sites, although the authors stress that this comparison does not constitute independent quantitative validation, because no independent, spatially explicit flood inventory was available for the study event.
That caveat points to the study’s most important limitation, which the authors state explicitly: some variables used to build the consensus flood inventory, including the SAR-derived indicators, NDWI and REM, also serve as predictors in the machine learning models. The reported performance therefore measures the models’ ability to discriminate the consensus-derived inventory rather than an independent ground-truth flood inventory, and this shared information between label generation and predictor construction may introduce target-predictor dependence. The results are interpreted as an assessment of model consistency with the multi-sensor inventory, and independent flood observations are required to establish external validity. The analysis is also limited to a single monsoon season, and the 30-meter spatial resolution may not capture fine-scale drainage pathways or localized inundation patterns.
Within those limits, the authors position the framework as a reproducible and computationally scalable alternative rather than a demonstrated improvement over existing methods, noting that differences in study area, data, label generation, resolution and evaluation prevent any performance ranking across published studies. Because every predictor can be generated in cloud-based geospatial platforms, the approach avoids the extensive calibration of hydrodynamic models and could suit operational flood monitoring in data-poor tropical cities. Planned future work includes testing across multiple monsoon seasons and flood events, coupling the framework with forecast precipitation products for early-warning applications, exploring spatially explicit deep learning architectures such as U-Net, combining the data-driven pipeline with physics-based hydrodynamic models for flood-depth estimation, and adding uncertainty quantification and explainable artificial intelligence methods. The processed datasets, predictors, training data and consensus-derived flood labels are publicly available through Zenodo under a Creative Commons Attribution 4.0 licence, with code available from the authors on reasonable request.
Subject of Research: A hydrologically enhanced machine learning framework for mapping urban flood inundation in Mumbai using multi-sensor satellite remote sensing data
Article Title: Hydrologically enhanced machine learning framework for urban flood inundation mapping using multi-sensor remote sensing data: a case study of Mumbai, India
Article References: Pawar, A. S., & Phade, G. M. (2026). Hydrologically enhanced machine learning framework for urban flood inundation mapping using multi-sensor remote sensing data: a case study of Mumbai, India. Natural Hazards and Earth System Sciences, 26(10), 5119-5131. https://doi.org/10.5194/nhess-26-5119-2026
Image Credits: AI Generated
DOI: 10.5194/nhess-26-5119-2026
Keywords: urban flooding, machine learning, XGBoost, flood mapping, Mumbai, Sentinel-1, Sentinel-2, SRTM, CHIRPS, Google Earth Engine, remote sensing, hydrologic predictors
Cite Scienmag News
Violet Maxwell. (October 27, 2026). Machine learning maps Mumbai’s flood zones with terrain and rainfall data. Scienmag. https://scienmag.com/machine-learning-maps-mumbais-flood-zones-with-terrain-and-rainfall-data/
Violet Maxwell. "Machine learning maps Mumbai’s flood zones with terrain and rainfall data." Scienmag, 27 October 2026, https://scienmag.com/machine-learning-maps-mumbais-flood-zones-with-terrain-and-rainfall-data/. Accessed 1 November 2026.
Violet Maxwell. "Machine learning maps Mumbai’s flood zones with terrain and rainfall data." Scienmag. October 27, 2026. https://scienmag.com/machine-learning-maps-mumbais-flood-zones-with-terrain-and-rainfall-data/