


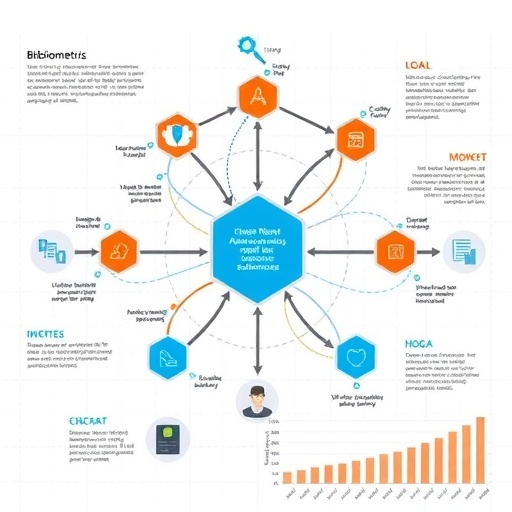
A new graphical review argues that bibliometric analysis could become one of biomedicine’s most powerful navigation systems, helping researchers see where health science is moving before the direction becomes obvious from individual studies. Rather than examining one disease, treatment or laboratory result, bibliometrics treats the scientific literature itself as data. By analyzing publication records, keywords, author affiliations, citations and collaboration links, researchers can construct maps of entire fields, identify rapidly expanding topics and expose areas that remain scientifically neglected. The review, published online in Current Research in Biotechnology, presents the approach as a strategic tool for research planning, funding decisions and health-policy development. Its central message is that the explosive growth of medical literature has made traditional, purely manual approaches increasingly difficult, while computational analysis can provide a scalable view of the biomedical knowledge landscape.
The need for such tools is driven by the sheer expansion and globalization of science. International databases now contain millions of records, reflecting the growth of research infrastructure, new technologies and cross-border collaboration. In health sciences, this expanding literature is particularly consequential: biomedical research influences healthcare systems, life expectancy, pharmaceutical innovation and economic development, while aging populations and rising burdens of chronic and rare diseases are increasing pressure on research institutions to spend resources wisely. A conventional review may offer a detailed assessment of a carefully defined question, but it is poorly suited to reveal the broad structure of a rapidly changing field. Bibliometrics addresses that problem by measuring patterns at scale. The review describes the method as resting on three principles: objectivity through standardized metadata, scalability across very large datasets and reproducibility through transparent searches and formal analytical procedures.
At its most basic level, bibliometric analysis converts scientific records into measurable relationships. Articles, reviews, conference papers and books become units of analysis, while their titles, abstracts and keywords provide textual signals about research themes. Authors and their affiliations reveal the social and geographic organization of science. Journals show where knowledge is being disseminated, and citations provide links between publications that can be used to reconstruct intellectual influence. A co-authorship network, for example, represents researchers or institutions as nodes connected by lines when they publish together. A citation network links papers according to references, while a keyword co-occurrence network connects terms that repeatedly appear in the same documents. Network measures can then identify highly connected hubs, tightly grouped communities and bridging nodes that connect otherwise separate specialties. These maps do not directly measure whether a scientific claim is true, but they can reveal how knowledge is organized and where attention is concentrating.
The review outlines a workflow that begins with a clearly defined research question and a search strategy designed to retrieve relevant publications. Scopus and Web of Science are widely used because of their standardized indexing, while PubMed is particularly important for biomedical literature. Yet the authors warn that relying on a single database can distort the picture. Databases differ in their journal coverage, disciplinary emphasis and representation of non-English research. Combining sources can improve completeness, but it introduces a technical challenge: records must be merged, duplicate articles removed, author names standardized and keywords harmonized. The same researcher may appear under different name formats, and identical concepts may be represented by multiple terms. Software such as the Bibliometrix package for R can assist with this data cleaning and integration. The quality of the final map depends heavily on these preprocessing decisions; a polished visualization cannot correct a biased or poorly assembled dataset.
Once the data are prepared, researchers can use several complementary analytical techniques. Co-occurrence analysis counts how often terms appear together, allowing thematic clusters to emerge from the literature. In a network visualization, frequently used terms may appear as larger nodes, while the strength of their connections indicates how often they occur in the same publications. Citation and co-citation analysis can identify foundational studies and intellectual turning points, whereas bibliographic coupling links papers that cite many of the same sources. Temporal analysis adds a further dimension by showing when themes appear, grow or decline. CiteSpace, for example, can detect citation bursts—periods when a publication or concept receives an unusual surge of attention. VOSviewer is designed for mapping and clustering networks involving authors, journals, publications and keywords. Gephi supports interactive analysis of large and complex networks, while Bibliometrix provides a flexible, open-source framework for statistical analysis and science mapping.
The review also examines how scientific influence is quantified, while emphasizing that no single metric can capture research quality. Publication counts indicate output, but not necessarily importance. Citation counts measure how often work is referenced, although citations may reflect disagreement, methodological reuse or merely visibility rather than endorsement. Citations per publication provide an average impact measure, and the h-index combines productivity with citation performance by identifying the number of papers that have each received at least that number of citations. Because citation behavior varies among disciplines and publication years, field- and time-normalized indicators such as the Category Normalized Citation Impact and Field-Weighted Citation Impact can make comparisons fairer. Alternative metrics, or altmetrics, track online attention through social-media mentions, views and downloads. These measures may reveal rapid public or professional engagement before conventional citations accumulate, but they too require careful interpretation and should not be treated as direct proxies for scientific validity.
Across health sciences, the review describes a remarkably broad range of applications. Disease-focused mapping can track research growth, identify leading countries and institutions, reveal dominant themes and expose gaps between scientific attention and disease burden. Previous bibliometric studies have charted rapid expansion in COVID-19 research, microbiome science and cancer immunotherapy. In clinical research, citation and collaboration networks can show how trials, interventions and outcomes are connected, while publication patterns may illuminate the rising use of randomized trials, systematic reviews and meta-analyses. Pharmaceutical researchers can map innovation from early discovery to clinical development, particularly when publication data are linked with patents. Such analyses can expose connections between universities and industry and help assess whether laboratory advances are moving toward practical therapies. The same approach can monitor drug safety, nanomedicine, advanced delivery systems and open innovation in pharmaceutical research.
Public-health applications extend beyond tracking diseases and medicines. During outbreaks such as Ebola, Zika and COVID-19, publication surges reveal how quickly research communities mobilize around emerging threats. Bibliometric maps can also follow work on vaccination, epidemiological surveillance, big-data systems, food safety and the social determinants of health. In the digital sphere, researchers are using the method to study health misinformation, including the roles of social media, retracted papers, health literacy and digital literacy in shaping the spread and interpretation of unreliable claims. Precision medicine offers another major application: keyword and citation analysis can chart research on gene–disease relationships, biomarkers, genome editing and CRISPR, alongside debates about genetic privacy, informed consent and data governance. Mental-health research can be compared across disorders such as depression, anxiety, schizophrenia and post-traumatic stress disorder, revealing shifts in treatment priorities, stigma research and disparities between countries.
The review presents digital health, aging and international collaboration as areas where bibliometrics may be especially useful in the coming years. Mapping publications on telemedicine, artificial intelligence, radiology, pathology, wearable devices, electronic health records, virtual reality and the Internet of Things can show which technologies are maturing and which remain speculative. In aging research, bibliometric trends highlight growing interest in multimorbidity, prevention, healthy aging, lifestyle interventions and the economic management of chronic disease. Co-authorship analysis can reveal whether expertise is concentrated within wealthy research systems or distributed through partnerships involving countries with different income levels. It can also show links among medicine, engineering, data science and the social sciences. In this way, bibliometrics becomes more than a retrospective count of papers: it can help funding agencies identify neglected priorities, assess the reach of research programs and recognize emerging collaborations before they become established institutions.
But the authors stress that scientific maps can mislead when their limitations are ignored. Major databases often favor English-language journals, creating regional and linguistic bias. Positive findings are more likely to be published than negative or inconclusive results, meaning that publication maps may overrepresent apparent success. New papers also face a citation time lag, and older work has had more opportunity to accumulate influence. Self-citations, inconsistent metadata and differences in citation customs can further distort comparisons. A citation demonstrates that one work has been mentioned, not that its conclusions have been accepted. Most importantly, bibliometrics cannot directly determine the quality of a study, the reliability of its methods, the clinical value of a discovery or whether an intervention improves patient outcomes. The review therefore recommends combining quantitative mapping with expert assessment and systematic reviews, which provide deeper evaluations of methods and results. Future systems may add real-time publication monitoring, artificial-intelligence-assisted evidence synthesis, open databases, preprints and policy-level impact measures, but the authors caution that AI should support—not replace—human scientific judgment.
Cite Scienmag News
Drew Townsend. (August 28, 2026). Graphical Review of Bibliometric Methods and Applications in Health Sciences. Scienmag. https://scienmag.com/graphical-review-of-bibliometric-methods-and-applications-in-health-sciences/
Drew Townsend. "Graphical Review of Bibliometric Methods and Applications in Health Sciences." Scienmag, 28 August 2026, https://scienmag.com/graphical-review-of-bibliometric-methods-and-applications-in-health-sciences/. Accessed 3 September 2026.
Drew Townsend. "Graphical Review of Bibliometric Methods and Applications in Health Sciences." Scienmag. August 28, 2026. https://scienmag.com/graphical-review-of-bibliometric-methods-and-applications-in-health-sciences/


