


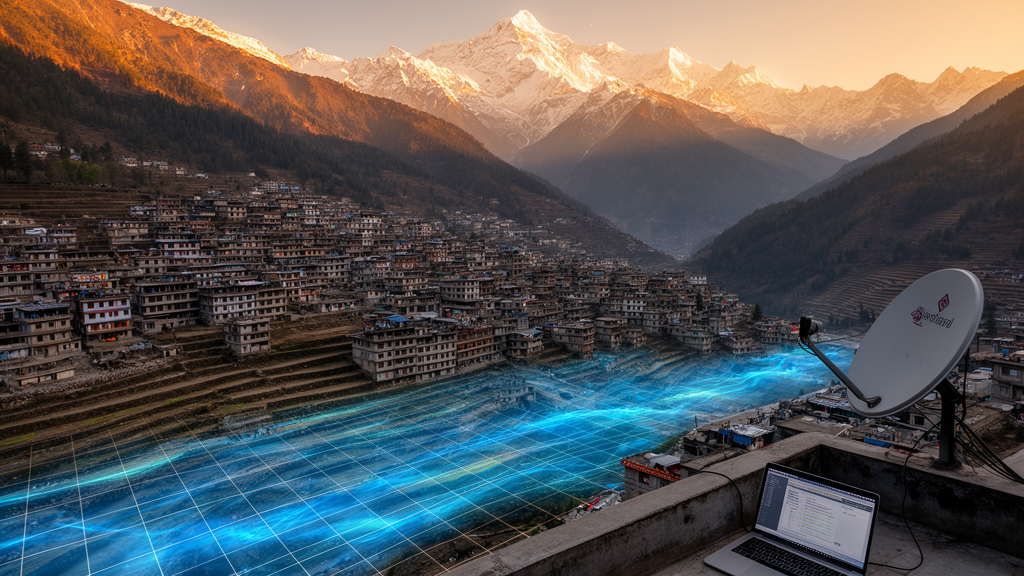
Deep in the Kumaon Inner Lesser Himalaya, where the Soar Valley cradles one of Uttarakhand’s fastest-growing urban populations, a team of Indian geologists has produced the most detailed picture yet of where groundwater is likely to hide beneath the region’s fractured, fault-stitched rocks. Writing in the journal Discover Geoscience, Deepak Pant and Kalpana Gururani of Soban Singh Jeena University, together with colleagues at Kumaun University, Government PG College Chamoli and the University of Lucknow, describe how they combined satellite imagery, digital elevation data and a structured decision-making technique to map groundwater potential across roughly 626 square kilometres of Pithoragarh district. Their findings carry real weight for a region where springs are the lifeline of mountain communities and where rapid urban expansion is quietly rewriting the rules of recharge.
The challenge the researchers faced is one that defines hydrogeology across the entire Himalayan arc. Unlike the vast alluvial aquifers of the plains, mountain groundwater is not stored in generous underground sponges. Instead, it occupies a patchwork of fractures, joints, weathered zones and thin valley-fill deposits, all controlled by an extraordinarily complex geological history. The Soar Valley sits within terrain dominated by Precambrian and Paleozoic rocks, bounded to the south by the Main Boundary Thrust and to the north by the Main Central Thrust, with the North Almora Thrust, Berinag Thrust and Munsiari Thrust slicing the landscape into juxtaposed units of contrasting permeability. Limestone and dolomite of the Deoban and Gangolihat formations can store and transmit water through solution-widened fractures, while the slates and phyllites of the Mandhali Formation, locally known as Soar Slates, resist flow except along cracks and weathered zones. Whether a given hillside yields water or sheds it can change within a few hundred metres.
To bring order to this complexity, the team adopted a multi-criteria decision analysis framework built on the Analytic Hierarchy Process, or AHP, a weighting method developed by mathematician Thomas Saaty that has become a workhorse of environmental mapping. Eight thematic layers were assembled: rainfall, geology, lineament density, land use and land cover, geomorphology, drainage density, slope and elevation. Each layer was derived from a different source, including India Meteorological Department rainfall data averaged over 2021 to 2024, Valdiya’s classic 1980 geological map of the Kumaon Himalaya, lineaments extracted from ASTER elevation data and cross-checked against the Geological Survey of India’s Bhukosh database, a 2025 Sentinel-2 land cover product from Esri, and geomorphological units from the same GSI archive. Every dataset was resampled to a common 30-metre grid and projected into a single coordinate system so that the layers could be stacked and compared pixel by pixel.
The AHP procedure required the researchers to judge, pairwise, how much each factor matters for groundwater occurrence, using Saaty’s one-to-nine importance scale. When the resulting comparison matrix was solved, rainfall emerged as the heaviest influence at roughly 25.7 percent, followed closely by geology at 24.1 percent and lineament density at 20.2 percent. Land use and land cover received a moderate 11 percent, geomorphology 7.8 percent, drainage density 5.2 percent, slope 3.6 percent and elevation just 2.4 percent. The logic is straightforward: rain is the ultimate source of recharge, rock type governs how much water the subsurface can hold, and fractures act as the highways along which water infiltrates and moves. Slope and elevation, by contrast, exert only indirect control by shaping runoff and topographic position. Crucially, the team checked the internal consistency of their judgments using Saaty’s consistency ratio, obtaining a value of 4.4 percent, comfortably below the 10 percent threshold above which expert judgments are considered unreliable.
With weights in hand, the researchers ran a weighted overlay in ArcGIS, multiplying each layer’s weight by the favourability rating of its subclasses and summing the results into a Groundwater Potential Index. The index was then classified into five zones, from very low to very high. The headline result is striking: only 0.01 percent of the study area, a fraction of a square kilometre, qualified as very high potential, while 92.76 percent fell into the moderate and high categories and 7.23 percent into the low and very low classes. The moderate zone alone covered 426.73 square kilometres, or 68.11 percent of the area, with the high zone adding another 154.42 square kilometres. In other words, despite receiving between roughly 1,858 and 2,442 millimetres of monsoon rainfall a year, the landscape offers almost no places where every favourable condition coincides. The best prospects cluster on the valley floor and in low-relief pockets where permeable lithology, gentle slopes and structural discontinuities overlap.
The spatial pattern tells a coherent geological story. High lineament densities, exceeding about 0.084 kilometres per square kilometre, mark zones of secondary porosity where tectonic deformation has cracked otherwise impermeable rock, and these patches align with some of the model’s more promising areas. Permeable units such as the Thalkedar Formation, the Damtha Group and the Gangolihat Formation scored well, whereas the compact quartzites of the Berinag Formation were rated low. Geomorphology reinforced the divide: active floodplains, piedmont alluvial plains, valley fills and water bodies earned high recharge ratings, while the highly dissected hills and valleys that blanket 87.52 percent of the study area were rated unfavourably. Land cover added a further layer of nuance, with tree cover and rangeland dominating the landscape and built-up areas, at 7.79 percent, concentrating in the urbanising valley where sealed surfaces suppress infiltration. The authors caution that satellite land-cover classification in fragmented Himalayan terrain carries real uncertainty, with small terraced fields easily confused with rangeland.
What separates this study from many earlier AHP-based groundwater maps is its quantitative validation. The team compiled 91 spring locations from systematic fieldwork across the valley and supplemented them with spring records from the CHIRAG Spring Atlas of Uttarakhand. Using a receiver operating characteristic analysis, they tested how well the model’s continuous potential index discriminated between locations where springs actually occur and the full range of index values. The result was an area under the curve of 0.795, a figure conventionally read as good discriminatory performance. Importantly, the spring data played no role in setting the AHP weights, so the validation tested an independent prediction rather than a model tuned to its own answers. The authors are careful to note the caveat that no independently confirmed absence dataset was available, meaning the statistic measures discrimination with respect to springs rather than absolute predictive accuracy, and that clustered spring distributions may influence the result.
The practical implications reach well beyond academic mapping. Because the zones represent relative suitability under the chosen criteria and thresholds rather than measured aquifer storage or sustainable yield, the authors position the map as a screening tool for prioritising follow-up work. Areas flagged as high or very high potential warrant detailed hydrogeological investigation, careful well-site assessment and controlled development, while the low and very low zones call for recharge enhancement, spring-shed protection, rainwater harvesting and runoff management. The team also emphasises protecting traditional mountain water infrastructure, including community ponds, naula and dhara spring structures and natural drainage channels, from encroachment and filling, and urges that urban planning in the valley incorporate permeable surfaces, green infrastructure and community-based water management so that growth does not sever the recharge pathways the aquifers depend on.
For a state where more than half of rural households depend on springs that many studies suggest are drying or becoming seasonal, the Soar Valley map offers something rare: a spatially explicit, quantitatively tested starting point for decisions about where to drill, where to recharge and where to build. The framework itself, integrating climatic, geological, structural, topographic and land-surface controls in a single validated model, is designed to be transferable to other fast-urbanising Himalayan valleys facing the same squeeze of rising demand and naturally constrained supply. The authors recommend that future work add seasonal groundwater-level monitoring, spring-discharge measurement and aquifer characterisation to sharpen the picture further. In a mountain system where a single misplaced borewell or paved-over recharge zone can undo decades of natural storage, knowing where the water is likely to be, and where it is not, may prove as valuable as the water itself.
Subject of Research: GIS-based groundwater potential zone mapping in the Kumaon Lesser Himalaya
Article Title: Hydro-geospatial modelling of groundwater potential zones in the soar valley and adjacent terrains of the Kumaon Lesser Himalaya using an integrated AHP–GIS framework
Article References: Pant, D., Gururani, K., Upadhyay, R., Singh, R. A., & Singh, A. K. (2026). Hydro-geospatial modelling of groundwater potential zones in the soar valley and adjacent terrains of the Kumaon Lesser Himalaya using an integrated AHP–GIS framework. Discover Geoscience, 4(1), Article 395. https://doi.org/10.1007/s44288-026-00766-1
Image Credits: AI Generated
DOI: 10.1007/s44288-026-00766-1
Keywords: groundwater, Himalaya, AHP, GIS, remote sensing, springs, hydrogeology, lineaments, Uttarakhand, recharge, multi-criteria decision analysis, urbanization
Cite Scienmag News
Violet Maxwell. (October 9, 2026). Satellites and Decision Science Map Hidden Groundwater in a Fast-Growing Himalayan Valley. Scienmag. https://scienmag.com/satellites-and-decision-science-map-hidden-groundwater-in-a-fast-growing-himalayan-valley/
Violet Maxwell. "Satellites and Decision Science Map Hidden Groundwater in a Fast-Growing Himalayan Valley." Scienmag, 9 October 2026, https://scienmag.com/satellites-and-decision-science-map-hidden-groundwater-in-a-fast-growing-himalayan-valley/. Accessed 9 October 2026.
Violet Maxwell. "Satellites and Decision Science Map Hidden Groundwater in a Fast-Growing Himalayan Valley." Scienmag. October 9, 2026. https://scienmag.com/satellites-and-decision-science-map-hidden-groundwater-in-a-fast-growing-himalayan-valley/


