


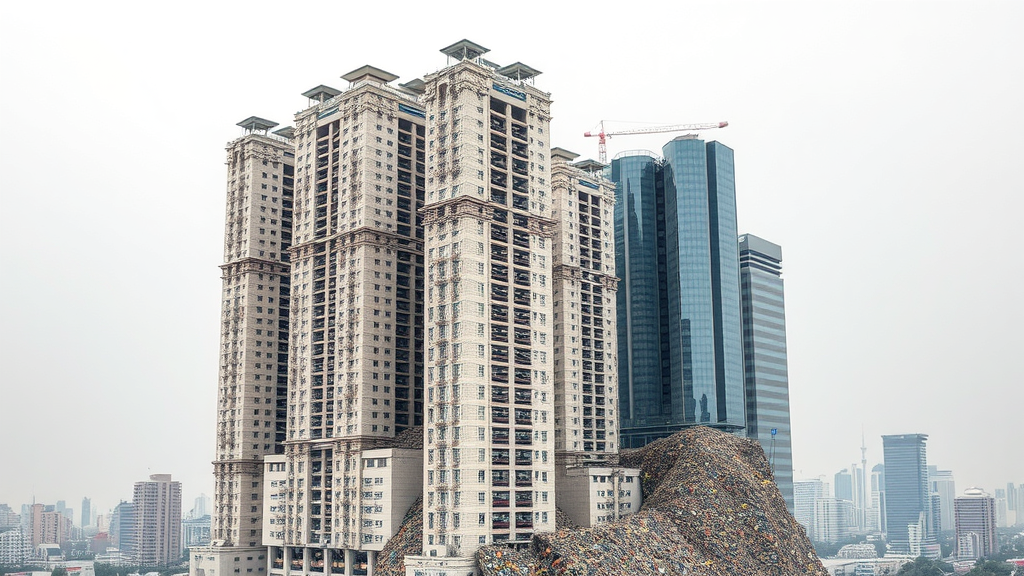
Humanity has now, quite literally, put the world’s buildings on a scale. In an unprecedented analysis published in Nature Cities, a team of researchers led by Jinchao Song of Peking University has constructed a harmonized global database covering more than 600 million individual buildings, arriving at a staggering figure: 835 gigatonnes of material are currently locked into the world’s built environment. The study offers the most spatially explicit picture yet of where the concrete, steel, brick and timber of civilization actually sit — and it reveals a planet divided not only by wealth, but by the sheer weight of what wealth has built.
The technical achievement behind the number is considerable. Rather than relying on coarse national statistics, the team fused multiple geospatial data streams, including global machine-learning-derived building footprints, satellite-based height estimates such as the ALOS World 3D digital surface model and World Settlement Footprint 3D products, land cover data from ESA WorldCover, and gridded population and income datasets. By combining building footprint area with estimated height and structure-specific material intensities calibrated against local bills of quantities, the researchers converted geometry into mass for every building they could resolve. The result is a building-level inventory that can be aggregated to national, city and neighborhood scales, exposing patterns that country-level averages have long concealed.
The headline finding is one of profound inequality. Per capita material stocks rise sharply with affluence, and low- and middle-income countries currently hold only 14 to 33 percent of the in-use building material per person found in high-income nations. In practical terms, a resident of a wealthy country is sheltered and served by several times more concrete, steel and glass than a resident of a rapidly urbanizing nation in the Global South. Because these materials carry enormous embodied energy and carbon — cement and steel production together account for a substantial share of global greenhouse gas emissions — this gap is not merely statistical. It represents an unfinished construction agenda for billions of people, one that will inevitably demand vast quantities of materials as living standards converge.
Yet the study complicates a simple narrative in which material demand tracks GDP in lockstep. The analysis shows that material accumulation increases sublinearly with income, meaning that as countries grow richer, each additional dollar of economic output is associated with progressively less additional building mass. The key moderator, the researchers find, is urban form: the density, height distribution and spatial arrangement of buildings within a city strongly shape how much material is needed to deliver a given level of housing or service floor area. Two cities with similar incomes and populations can differ dramatically in total material stock depending on whether they grow outward in low-rise sprawl or upward in compact blocks.
This insight produces what the authors describe as diverse and path-dependent trajectories. Cities inherit material legacies from decisions made decades ago; a city that urbanized through dense, homogeneous low-rise development embeds far less material per capita than one that expanded through dispersed, resource-intensive construction. These urban forms, once built, are effectively locked in for the lifetime of the structures, which typically span many decades. The study thus frames urban morphology not as an aesthetic detail but as a long-lived determinant of resource demand, with consequences for energy use, emissions and the feasibility of climate targets.
The forward-looking component of the analysis is where the stakes become explicit. In a scenario in which rapidly urbanizing regions follow the historical development pathways of today’s wealthy countries, global building material stocks could expand by an additional 419 gigatonnes by 2050. That figure dwarfs the current annual output of the cement and steel industries and implies a corresponding surge in embodied carbon emissions at precisely the moment the world needs to decarbonize. The scenario quantifies, in material terms, what it would mean for the urban South to simply replicate the urban North.
But the scenario analysis also contains the study’s most consequential message. If newly urbanizing regions instead adopt a dense and homogeneously low urban form — compact neighborhoods of consistent, modest building heights — the projected growth in material stocks could be reduced by roughly 30 percent. That saving does not require speculative technology or unproven materials; it requires planning choices about density, land use and building typology made now, before the bulk of 2050’s urban fabric is poured into place. Urban planning, the authors argue, is a key lever for sustainable development, arguably as important as material substitution or recycling in shaping future demand.
The database itself, publicly released via Zenodo, is expected to become a resource far beyond its immediate conclusions. Material stock maps of this resolution can inform circular economy strategies, identifying where future demolition flows of steel and concrete will emerge; they can refine estimates of urban heat exposure, seismic risk and embodied carbon accounting; and they provide a baseline against which future construction can be measured. Previous efforts, from city-scale studies in Beijing, Padua and the Netherlands to global models of residential material flows, have been limited in either resolution or coverage. A building-level inventory of 600 million structures bridges that gap.
For policymakers in fast-growing cities across Africa and South Asia, the implications are direct. The next three decades will see the largest wave of building construction in human history, and the analysis shows that the material bill for that wave is not fixed. It will be written by zoning codes, floor-area ratios, infrastructure investment and the degree to which cities coordinate density with livability. The 835 gigatonnes already standing demonstrate what past development choices have cost; the 419-gigatonne scenario shows what replication would cost; and the 30-percent savings identified by the researchers show what thoughtful urban form could save. Weighing the world’s buildings, it turns out, is also a way of weighing the world’s options.
Subject of Research: A building-level global assessment of material stocks in more than 600 million buildings, quantifying urban material inequality and the role of urban form in future material demand.
Article Title: Weighing 600 million buildings reveals global urban material inequality and efficiency paths
Article References: Song, J., Sun, K., Goldstein, B. P., Tong, X., Wang, L., Helbich, M., Liu, Q., Dai, M., Li, X., & Liu, G. (2026). Weighing 600 million buildings reveals global urban material inequality and efficiency paths. Nature Cities. https://doi.org/10.1038/s44284-026-00510-3
Image Credits: AI Generated
DOI: 10.1038/s44284-026-00510-3
Keywords: building material stocks, urbanization, material inequality, urban form, sustainable development, embodied carbon, Nature Cities, global database, urban planning, material efficiency, Global South, scenario analysis
Cite Scienmag News
Denise Maddox. (September 12, 2026). Weighing 600 Million Buildings Exposes Stark Global Inequality in Urban Materials. Scienmag. https://scienmag.com/weighing-600-million-buildings-exposes-stark-global-inequality-in-urban-materials/
Denise Maddox. "Weighing 600 Million Buildings Exposes Stark Global Inequality in Urban Materials." Scienmag, 12 September 2026, https://scienmag.com/weighing-600-million-buildings-exposes-stark-global-inequality-in-urban-materials/. Accessed 4 October 2026.
Denise Maddox. "Weighing 600 Million Buildings Exposes Stark Global Inequality in Urban Materials." Scienmag. September 12, 2026. https://scienmag.com/weighing-600-million-buildings-exposes-stark-global-inequality-in-urban-materials/


