
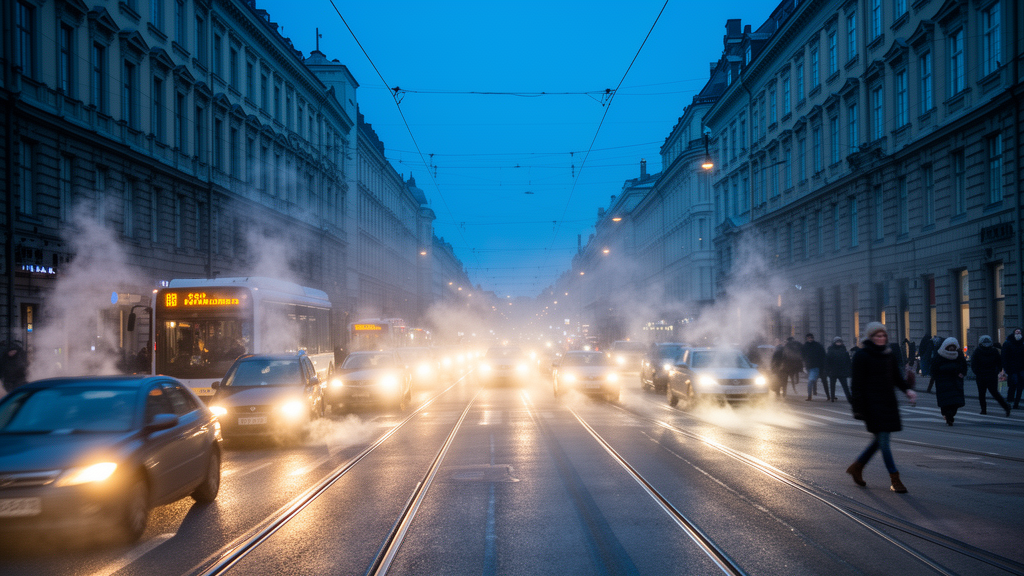
Scientists measuring the air in one of Helsinki’s busiest street canyons have found that the real-world emissions of the city’s vehicle fleet vastly exceed the limits that Europe imposes on new cars, and that road traffic exerts surprising inverse and indirect effects on urban air that conventional emission accounting never captures. The study, led by Lauri K. Savolainen and Teemu Lepistö of Tampere University together with colleagues from the Finnish Meteorological Institute, the Helsinki Region Environmental Services Authority and the University of Helsinki, was published in Atmospheric Chemistry and Physics. By using carbon dioxide as a tracer for fuel consumption, the team calculated fleet-wide emission factors not only for regulated pollutants such as nitrogen oxides and particulate matter, but also for a suite of emerging and unregulated species, including semi-volatile ultrafine particles, volatile organic compounds and polycyclic aromatic hydrocarbons.
The measurement campaign took place between 17 January and 22 February 2022 at an air quality monitoring supersite on Mäkelänkatu, a 42-metre-wide street canyon lined with buildings 16 to 19 metres tall that limit the dilution of pollutants. Roughly 17,000 vehicles passed the station each weekday, about 10 percent of them heavy-duty. Wintertime conditions were typical for southern Finland, with a mean temperature of −1.4 °C and high relative humidity averaging 89 percent. The instruments deployed included condensation particle counters, a differential mobility particle sizer, a neutral cluster and air ion spectrometer, an aethalometer for black carbon, a soot particle aerosol mass spectrometer for submicron particle chemistry, and an in-situ thermal desorption gas chromatograph mass spectrometer for volatile organic compounds.
The emission factor method is elegantly simple in principle. Because elevated carbon dioxide levels near a road almost certainly originate from the traffic burning fuel there, any other pollutant can be normalized to the amount of fuel burnt by examining how its concentration rises with carbon dioxide. The researchers divided the carbon dioxide data into 5 ppm bins, averaged pollutant concentrations geometrically within each bin, and applied a linear fit in the range of 420 to 465 ppm, which covered 99.2 percent of the non-episodic data. The squared correlation values of these averaged fits exceeded 0.93 for particle number, black carbon, particulate matter and lung-deposited surface area, confirming that road traffic was the dominant local source of these pollutants during the campaign.
The headline finding is stark: the fleet emission factors for particulate matter and nitrogen oxides were considerably higher than the limits required for new vehicles under the EURO6 standard, which has applied since 2014. Assuming an average fuel consumption of 11 litres per 100 kilometres, the measured particle number emission factor would be roughly 2.1 × 10¹⁴ particles per kilometre, some 350 times the EURO limit of 6.0 × 10¹¹ particles per kilometre for primary particles larger than 23 nanometres. The discrepancy is largely explained by semi-volatile compounds and particles smaller than 23 nanometres, which the standards do not regulate, and by the fact that diesel particulate filters, while effective against black carbon and accumulation-mode particles, remain ineffective at controlling nucleation-mode particles below 30 nanometres.
For nitrogen oxides, the carbon dioxide-based fleet emission factor of 0.522 grams per kilometre agreed closely with a bottom-up emission inventory calculation of 0.545 grams per kilometre based on the Handbook of Emission Factors for Road Transport, yet both are several times higher than the EURO6 limits of 0.06 to 0.08 grams per kilometre. The inventory analysis revealed why: gasoline vehicles, despite accounting for 45 percent of total mileage, contributed only 5 percent of nitrogen oxide emissions, while diesel vehicles contributed 52 percent and vans, diesel city buses and trucks a further 43 percent. A quarter of the diesel cars on the street were EURO4 or older, without a diesel particulate filter. The results point to the slow renewal of the vehicle fleet and the presence of so-called super-emitters, such as old heavy-duty vehicles and vehicles with malfunctioning exhaust after-treatment systems, as the dominant reason real-world fleet emissions remain so high.
The chemical composition measurements showed that submicron particulate emissions from the fleet are dominated by organic compounds, with an emission factor of 74.2 milligrams per kilogram of fuel, and black carbon at 52.5 milligrams per kilogram, an organics-to-black-carbon ratio of about 1.4. The particulate matter 10 emission factor was 2.81 times higher than that for particulate matter 2.5, and its diurnal variation, rising during daytime traffic and falling to near zero at other times, suggests an important contribution from non-exhaust sources such as road dust, tyre wear and braking, which will be regulated for the first time under the EURO7 standard in 2026. Among the volatile organic compounds, all 18 studied aromatic hydrocarbons correlated strongly with carbon dioxide, with the aromatic fraction, especially toluene and p/m-xylene, dominating the fleet emissions at a summed emission factor of 149.2 milligrams per kilogram of fuel.
Beyond direct emissions, the study introduces a new concept, the impact factor, to describe pollutant metrics whose concentrations fall as traffic increases. Ozone was the clearest example: its impact factor was negative, at −2.17 grams per kilogram of fuel, and ozone was almost completely depleted once carbon dioxide concentrations reached about 465 ppm. The explanation lies in atmospheric chemistry, because ozone oxidizes nitric oxide to nitrogen dioxide. During high-traffic periods with reduced dispersion, nitric oxide rose steeply while nitrogen dioxide plateaued, exactly the pattern expected when ozone is exhausted. This inverse relationship matters for long-term air quality trends: while urban ozone has declined since the 1960s, concentrations have increased near European traffic sites, and at the Helsinki station ozone grew at 3.52 percent per year between 2015 and 2019 while nitric oxide and nitrogen dioxide fell. As nitrogen oxide emissions continue to decrease, urban ozone exposure may rise, raising the question of whether nitrogen dioxide alone, the only metric considered by the World Health Organization and the EU’s new air quality directive, is the most appropriate measure of nitrogen oxide impacts at trafficked locations.
A second paradox emerged with atmospheric ions. Small ions below about 2 nanometres, formed naturally by cosmic rays, gamma radiation and radon decay, showed inverse impact factors, their concentrations dropping during rush hours as traffic increased. Yet direct engine exhaust measurements have shown that traffic is itself a source of such ions. The researchers attribute the negative impact factors to the increased coagulation sink created by traffic particles, which collide with and scavenge the smallest ions, with possible additional contributions from recombination. Meanwhile, intermediate and larger ions showed positive impact factors. Perhaps most unexpected were the terpenoid volatile organic compounds, typically considered biogenic: α-pinene and limonene, among others, showed clear positive correlations with carbon dioxide, with impact factors exceeding 2 milligrams per kilogram of fuel. Since natural sources emit negligible terpenoids in Finnish winter, the results suggest road traffic directly influences these compounds, possibly through tailpipe emissions, recently washed vehicles or windshield washer fluid, though the mechanism remains poorly understood.
The study also demonstrated the method’s vulnerability. During three regional and long-range transported pollution episodes, when biomass burning aerosols accumulated under temperature inversions, episodic emission factors for particulate matter 2.5 rose by 219 percent, benzene by 137 percent and black carbon by 31 percent, while particle number and nitrogen oxide factors fell by 54 and up to 38 percent. Sulfate, which showed no connection to carbon dioxide during non-episodic periods, yielded an apparent emission factor of 88 milligrams per kilogram of fuel during the episodes, a clear example of how unrecognized background sources could mislead interpretation. The authors conclude that the influence of road traffic should not be treated as a simple linear multiplication of direct emissions and traffic rate, since some impacts follow step-function-like behavior. Their carbon dioxide-based approach, they argue, offers a relatively simple way to quantify the direct, inverse and indirect effects of traffic on urban air across different locations and conditions, provided that interfering sources are carefully identified.
Subject of Research: From direct emission factors to inverse and indirect impact factors of road traffic: influence of emerging and unregulated pollutants
Article Title: From direct emission factors to inverse and indirect impact factors of road traffic: influence of emerging and unregulated pollutants
Article References: Savolainen, L. K., Lepistö, T., Hellén, H., Lintusaari, H., Jäppi, M., Niemi, J. V., Teinilä, K., Aurela, M., Lampimäki, M., Kousa, A., Lampilahti, J., Lehtipalo, K., Petäjä, T., Dal Maso, M., Manninen, H. E., Timonen, H., & Rönkkö, T. (2026). From direct emission factors to inverse and indirect impact factors of road traffic: influence of emerging and unregulated pollutants. Atmospheric Chemistry and Physics, 26(20), 14823-14841. https://doi.org/10.5194/acp-26-14823-2026
Image Credits: AI Generated
DOI: 10.5194/acp-26-14823-2026
Keywords: road traffic, emission factors, ultrafine particles, street canyon, nitrogen oxides, ozone, volatile organic compounds, black carbon, non-exhaust emissions, impact factors, Helsinki, air quality
Cite Scienmag News
Russell Cooper. (October 24, 2026). Traffic Emissions in Helsinki Reveal Hidden Inverse and Indirect Impacts on Urban Air. Scienmag. https://scienmag.com/traffic-emissions-in-helsinki-reveal-hidden-inverse-and-indirect-impacts-on-urban-air/
Russell Cooper. "Traffic Emissions in Helsinki Reveal Hidden Inverse and Indirect Impacts on Urban Air." Scienmag, 24 October 2026, https://scienmag.com/traffic-emissions-in-helsinki-reveal-hidden-inverse-and-indirect-impacts-on-urban-air/. Accessed 24 October 2026.
Russell Cooper. "Traffic Emissions in Helsinki Reveal Hidden Inverse and Indirect Impacts on Urban Air." Scienmag. October 24, 2026. https://scienmag.com/traffic-emissions-in-helsinki-reveal-hidden-inverse-and-indirect-impacts-on-urban-air/