


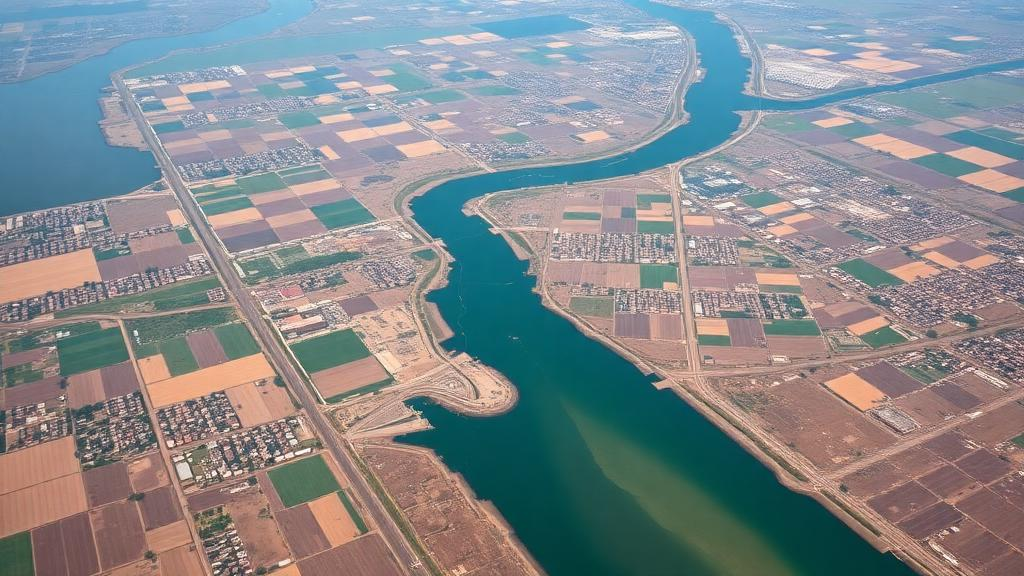
Along the eastern edge of the Kolkata Metropolitan Region, a small, silt-choked river is quietly documenting one of the most consequential stories in modern environmental science: the transformation of a living delta into a densely engineered landscape. The Suti River, a 66.4-kilometre distributary of the Bidyadhari system in West Bengal, drains a catchment of just over 383 square kilometres, yet its fate mirrors that of countless non-perennial rivers across South Asia. A new study published in Discover Geoscience has now tracked three decades of land use and land cover change across the Suti Basin, and projected those trends forward to 2030, revealing a landscape in the grip of a dramatic transition from fallow and semi-natural land to intensive agriculture and urban settlement.
The research team, led by Aritra Mandal and colleagues at the Department of Geography, Adamas University in Kolkata, assembled a multi-temporal record from Landsat 5 Thematic Mapper, Landsat 7 Enhanced Thematic Mapper Plus, and Landsat 8 Operational Land Imager imagery spanning 1990 to 2020. Before any classification could begin, the satellite scenes were corrected using the Atmospheric and Topographic Correction model, which removes distortions introduced by humidity and aerosol scattering, a critical step in the humid Gangetic delta where atmospheric interference can blur the spectral signatures that distinguish one land cover type from another. Only after this radiometric harmonisation could the team trust that differences between images reflected real changes on the ground rather than artefacts of the sensors or the atmosphere.
For the classification itself, the researchers turned to a Support Vector Machine, a supervised machine learning algorithm prized for its ability to construct optimal separating hyperplanes in high-dimensional feature space. That mathematical property matters enormously in a deltaic landscape, where silted riverbeds, wetlands, and agricultural fields can share deceptively similar spectral profiles. The team implemented the classifier with a Radial Basis Function kernel, tuning the penalty parameter to 100 and the gamma value to 0.1 through grid search and cross-validation, while maintaining a minimum of 100 training samples per class. Accuracy assessment using stratified random sampling and error matrices yielded Kappa coefficients between 0.82 and 0.91 across the four epochs, comfortably exceeding the 0.85 threshold generally accepted for reliable land cover mapping, with the 2020 classification achieving the highest overall accuracy at 95 percent.
The resulting maps tell a striking story of transformation. In 1990, fallow land dominated the basin, covering 199.34 square kilometres, or 52.04 percent of the total area, a signature of extensive shifting cultivation and underutilised ground. Agricultural land accounted for 22.02 percent, homestead vegetation for 14.26 percent, while urban settlement occupied a modest 5.22 percent and aquaculture 5.52 percent. Water bodies were almost negligible at 0.82 percent, underscoring the basin’s dependence on seasonal hydrology. By 2020, that picture had been almost completely inverted: fallow land had collapsed to 11.48 percent of the basin, while agricultural land and homestead vegetation had risen to become co-dominant classes at 36.74 and 36.17 percent respectively, and urban settlement had more than doubled its footprint.
To move beyond static area statistics, the study deployed two indices that capture the velocity and intensity of landscape change. The Land Use Dynamic Degree, expressed as K percent, calculates the annualised rate of change for each land use class, allowing direct comparison of how quickly different categories are expanding or contracting. The Urban Expansion Intensity Index normalises the growth of built-up area against the total basin area and the length of the time interval, enabling comparisons across dissimilar periods. Together, these metrics identified the decade between 2000 and 2010 as the basin’s most turbulent phase. Homestead vegetation expanded at a peak rate of 7.05 percent per year during that interval, urban settlement at 6.48 percent, while fallow land contracted at an accelerating pace that reached minus 6.22 percent per year by the final decade.
The Urban Expansion Intensity Index confirmed that urbanisation peaked between 2000 and 2010 at a low-intensity value of 0.441 percent, framed by a very low 0.146 percent in the 1990s and a near-negligible 0.024 percent between 2010 and 2020. This trajectory suggests the most explosive phase of urban conversion has already passed, with the basin now entering a period of densification rather than outward sprawl. Post-classification change detection added finer texture to the narrative: between 2010 and 2020, 48.77 square kilometres of fallow land and 30.62 square kilometres of agricultural land were converted to vegetated cover, while 4.94 square kilometres of vegetation was lost to settlement, the highest urban encroachment of any decade in the record.
When the researchers divided the river into three reaches, the spatial unevenness of change became apparent. Reach 1 and Reach 2, the segments closest to the expanding municipalities of Barasat and Kalyani, showed the most aggressive conversion, with fallow land in Reach 2 projected to shrink from 93.43 square kilometres in 1990 to just 2.08 square kilometres by 2030, and aquaculture in Reach 1 falling from 8.30 to 0.25 square kilometres over the same span. One-way analysis of variance confirmed that these reach-wise differences were statistically robust, with land use type explaining between 50.7 and 64.7 percent of the variance in class areas, and Duncan’s post-hoc tests cleanly separating extensive classes such as agriculture and homestead vegetation from compact ones such as water bodies and aquaculture.
The forward-looking component of the study rested on a Markov chain model, which treats land cover change as a probabilistic transition system governed by a transition probability matrix derived from observed changes between 2010 and 2020. The matrix revealed, for instance, that only 59.14 percent of agricultural land persisted in its class over that decade, while 34.75 percent reverted to fallow, hinting at declining soil fertility or shifting economic incentives. Urban areas, though only 31.74 percent persistent, sprawled into 31.91 percent of neighbouring farmland. Monte Carlo simulations with 1,000 iterations quantified the uncertainty around the 2030 projections, and validation against observed data produced a Kappa statistic of 0.861 and a chi-square value of 0.052, well below the critical threshold of 11.17, indicating strong agreement between prediction and reality.
The 2030 forecast is sobering. Urban-related categories are projected to dominate the basin, with vegetated settlements covering 143.38 square kilometres, or 37.11 percent of the landscape, and fully urbanised areas covering 54.88 square kilometres, or 14.20 percent, together accounting for more than half of the entire catchment. Agricultural land is expected to slip to 36.55 percent, while water bodies and aquaculture shrink to marginal features of just 0.88 and 2.44 percent respectively. The authors caution that the Markov framework assumes past transition routines will persist, an assumption that future policy shifts, climate-driven changes in rainfall, and socio-economic upheavals could invalidate, and that Landsat’s coarse resolution limits its ability to resolve fragmentation in mixed-use landscapes.
What emerges from this research is a portrait of a river basin in a transient, unstable state, where chronic degradation of the channel through siltation, encroachment, and hydrological obstruction proceeds alongside relentless agricultural intensification and urban expansion. The consequences ripple outward: reduced freshwater flows toward the Sundarban delta, increased salinity intrusion, seasonal flooding in the municipalities that flank the river, and mounting pressure on food security as farmland gives way to concrete. The study’s authors argue that only integrated basin management, ecological restoration, and land use planning that prioritises agricultural zoning and green infrastructure can reconcile the competing demands of a growing population and a fragile deltaic ecosystem. For the Suti, and for the thousands of non-perennial rivers like it that have long escaped scientific scrutiny, the satellite record now offers both a warning and a baseline against which any future recovery will be measured.
Subject of Research: Spatiotemporal land use and land cover change and Markov-based future projection in the Suti River Basin, West Bengal, India
Article Title: Spatiotemporal land use and land cover change and future projection in the Suti River Basin, India
Article References: Mandal, A., Bhadra, T., Das, R., Banerjee, S., Sardar, R., Roy, S., & Sarkar, R. (2026). Spatiotemporal land use and land cover change and future projection in the Suti River Basin, India. Discover Geoscience, 4(1), Article 384. https://doi.org/10.1007/s44288-026-00734-9
Image Credits: AI Generated
DOI: 10.1007/s44288-026-00734-9
Keywords: land use land cover change, Suti River Basin, remote sensing, Support Vector Machine, Markov chain model, urbanisation, Gangetic delta, Landsat imagery, West Bengal, non-perennial river, change detection, sustainable land use planning
Cite Scienmag News
Violet Maxwell. (October 1, 2026). Satellites Reveal a Dying Delta River Being Swallowed by Farms and Cities. Scienmag. https://scienmag.com/satellites-reveal-a-dying-delta-river-being-swallowed-by-farms-and-cities/
Violet Maxwell. "Satellites Reveal a Dying Delta River Being Swallowed by Farms and Cities." Scienmag, 1 October 2026, https://scienmag.com/satellites-reveal-a-dying-delta-river-being-swallowed-by-farms-and-cities/. Accessed 4 October 2026.
Violet Maxwell. "Satellites Reveal a Dying Delta River Being Swallowed by Farms and Cities." Scienmag. October 1, 2026. https://scienmag.com/satellites-reveal-a-dying-delta-river-being-swallowed-by-farms-and-cities/


