


Groundwater is supplying more than 43 percent of the population in Ghana’s Sunyani West Municipality, but the same landscapes that help refill underground reserves may also be the places where pollution spreads most easily. A new study has produced the most detailed combined map yet of where groundwater is likely to be replenished and where aquifers are naturally vulnerable to contamination across the municipality. The findings reveal a critical environmental paradox: some of the areas most valuable for replenishing wells are also among the areas requiring the strongest protection from fertilizers, wastewater and poorly managed sanitation.
The research focused on a region underlain by Birimian crystalline rocks, ancient geological formations that cover much of the West African Craton. Unlike porous sandstone or gravel aquifers, these hard-rock systems do not generally store large quantities of water within the intact bedrock. Instead, groundwater accumulates in the weathered soil and rock above the bedrock, and in networks of fractures that allow water to move through otherwise impermeable formations. This creates an uneven underground landscape in which a productive borehole can stand relatively close to a poorly yielding one, even where the surface appears similar.
Sunyani West covers approximately 1,059 square kilometres in Ghana’s Bono Region and receives about 1,700 millimetres of rain each year. Rainfall arrives mainly during a major wet season from April to July and a shorter season between September and November. During these periods, water can infiltrate the ground when rainfall exceeds evaporation and surface runoff. How much water ultimately reaches the aquifer depends on a complicated interaction among soil, slope, vegetation, drainage, rock type and geological fractures. Urban expansion, agricultural development and widespread on-site sanitation are increasing the pressure on this recharge system.
To disentangle those influences, the researchers combined satellite observations, geological information and geographic information system analysis at a spatial resolution of 30 metres. They used seven factors to estimate relative recharge potential: geology, geomorphology, slope, soil type, land use and land cover, drainage density and lineament density. Lineaments are linear features visible in terrain and imagery that may indicate fractures or geological boundaries. In crystalline basement terrain, these structures can provide preferential pathways for infiltrating water, although a high density of lineaments does not automatically mean that the fractures are open, connected or hydraulically useful.
The team integrated the seven layers using the Analytical Hierarchy Process, or AHP, a structured decision-making method that assigns weights through pairwise comparisons. The method converts different environmental variables into standardized suitability scores and combines them into a composite recharge index. Gentle slopes generally received greater recharge suitability because they slow runoff and give water more time to infiltrate, while land cover influenced the balance between sealed urban surfaces, cultivated ground and vegetated areas. The resulting index was relative rather than quantitative: it identifies places that are more or less favourable for recharge, but does not measure the precise volume of water entering the aquifer.
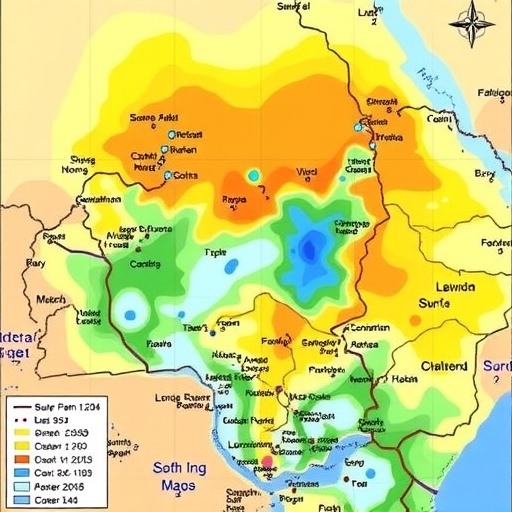
The map divided the municipality into five recharge classes, from lowest to highest. Contrary to a simple expectation that one side of the municipality would emerge as the region’s recharge centre, the highest and high-potential zones appeared as scattered and sometimes extensive patches across the western, central, southern, northern and eastern sectors. The lowest-potential areas were concentrated mainly in the east. This patchwork reflects the way multiple controls overlap: a gentle slope may favour infiltration, but a compacted surface can suppress it; a fracture may improve underground flow, but only if it is sufficiently connected and weathered.
The researchers compared the recharge map with production records from 102 boreholes. Well yields ranged from about 0.88 to 2.35 litres per minute, demonstrating the strong variability typical of fractured basement aquifers. Higher-yielding wells were more common in zones classified as having high or highest recharge potential, while lower yields were more frequent in low- and moderate-potential areas. A statistical analysis found a positive association between the recharge index and borehole yield, with an R² value of 0.7863. In practical terms, the pattern of recharge suitability explained much of the broad variation in well output, although it did not account for every local difference.
That distinction is important. Borehole yield is not a direct measurement of recharge. It also depends on the thickness of the weathered zone, the transmissivity of the aquifer, the size and connectivity of fractures, drilling depth, well construction and pumping conditions. A borehole in a high-recharge zone can still perform poorly if it misses a productive fracture, while a well in a less favourable area may encounter an unusually well-connected groundwater pathway. The authors therefore describe the borehole comparison as an independent consistency check, rather than definitive validation of the recharge model.
The second part of the study examined intrinsic vulnerability: the natural susceptibility of the aquifer to contamination if pollutants reach the land surface. For this analysis, the researchers used the F-HYDRA model, designed for regions where detailed hydrogeological data are scarce. The model combines flow accumulation, hydraulic conductivity and land use or land cover. Flow accumulation identifies places where surface water converges and may create focused infiltration. Hydraulic conductivity estimates how readily water and dissolved substances can move through subsurface materials. Land cover serves as an indicator of both hydrological behaviour and potential contaminant loading from agriculture, settlements and other human activities.
Hydraulic conductivity received the greatest weighting in the vulnerability calculation, accounting for 40 percent of the index, while flow accumulation and land cover each contributed 30 percent. The approach classified the municipality into five vulnerability levels. Moderate vulnerability was the dominant condition, forming a broad belt across the eastern part of the area. High and very high vulnerability occurred mainly in northern-central and eastern sections, where higher estimated conductivity and topographic convergence could allow contaminants to enter and migrate through the aquifer more readily. The lowest vulnerability zones were concentrated largely in the west and southwest, where lower conductivity, reduced flow accumulation and more extensive vegetation were associated with slower contaminant movement.
To test whether the vulnerability pattern corresponded with actual water-quality observations, the researchers analysed nitrate in samples from 20 boreholes. Nitrate is highly soluble and mobile, making it a useful indicator of pollution from fertilizers, septic systems, domestic wastewater and animal waste. The samples were collected between March and April 2020, with each borehole purged before sampling and the water preserved and analysed in a laboratory. Nitrate concentrations were generally higher in areas mapped as highly or very highly vulnerable, and regression produced an R² value of 0.7435 between nitrate concentration and the vulnerability index.
The result is striking, but it does not mean that the map alone predicts contamination. Intrinsic vulnerability describes the aquifer’s natural susceptibility; it does not reveal whether a pollutant source is actually present. A highly vulnerable area with no fertilizer use or leaking sanitation system may have clean groundwater, while a less vulnerable location with intense contamination loading can still show elevated nitrate. The study’s 20 samples also represent a limited snapshot from a single sampling campaign. Seasonal changes in rainfall, fertilizer application and groundwater flow could alter nitrate concentrations, as could differences in borehole depth, construction and pumping history.
The strongest warning emerges where the two maps overlap. Areas with relatively high recharge potential and elevated vulnerability are important because they can replenish groundwater efficiently, yet they can also transmit contaminants into the subsurface. Protecting such zones will require more than simply restricting groundwater abstraction. The researchers point to improved regulation of fertilizer use, careful siting and management of sanitation systems, targeted quality monitoring and land-use planning that recognizes the geological pathways connecting the surface to underground water. These areas may also be candidates for local groundwater protection zones.
The results offer a practical strategy for managing water in data-limited regions. Rather than waiting for a complete network of pumping tests, fracture logs, water-table measurements and long-term monitoring wells, authorities can use openly available satellite and environmental datasets to identify priority areas for investigation. The approach is inexpensive compared with comprehensive subsurface surveys and can help guide decisions about where to drill, where to monitor and where development may pose an unacceptable pollution risk. However, the maps should be treated as screening tools, not as substitutes for site-specific hydrogeological studies.
Several uncertainties remain. The hydraulic conductivity data came from the GLHYMPS global hydrogeology dataset, which provides regional estimates rather than measurements from individual boreholes. The analysis did not explicitly include groundwater depth, the properties of the unsaturated zone, recharge rates or the thickness of weathered regolith. Some mapped lineaments may not represent fractures that transmit water, and the soil layer varied relatively little because Ferric Acrisols dominate the municipality. Future work will need seasonal nitrate sampling, larger monitoring networks, pumping tests, field verification of fractures and direct measurements of weathering and groundwater levels.
Even with those limitations, the study demonstrates why groundwater availability and groundwater safety cannot be mapped independently. The places that receive and transmit water are not automatically protected from pollution; in fact, their permeability can make them more exposed. By combining recharge potential with contamination vulnerability, the Sunyani West assessment turns a pair of abstract environmental indices into a management signal: groundwater-rich landscapes may also be pollution-sensitive landscapes. In a region where millions rely on hard-rock aquifers and surface water can be unreliable, that insight could help determine whether underground reserves remain a dependable lifeline or become an invisible route for contamination.
Cite Scienmag News
Violet Maxwell. (August 27, 2026). Ghana’s Sunyani West Maps Groundwater Recharge Potential and Contamination Risks. Scienmag. https://scienmag.com/ghanas-sunyani-west-maps-groundwater-recharge-potential-and-contamination-risks/
Violet Maxwell. "Ghana’s Sunyani West Maps Groundwater Recharge Potential and Contamination Risks." Scienmag, 27 August 2026, https://scienmag.com/ghanas-sunyani-west-maps-groundwater-recharge-potential-and-contamination-risks/. Accessed 4 September 2026.
Violet Maxwell. "Ghana’s Sunyani West Maps Groundwater Recharge Potential and Contamination Risks." Scienmag. August 27, 2026. https://scienmag.com/ghanas-sunyani-west-maps-groundwater-recharge-potential-and-contamination-risks/


