


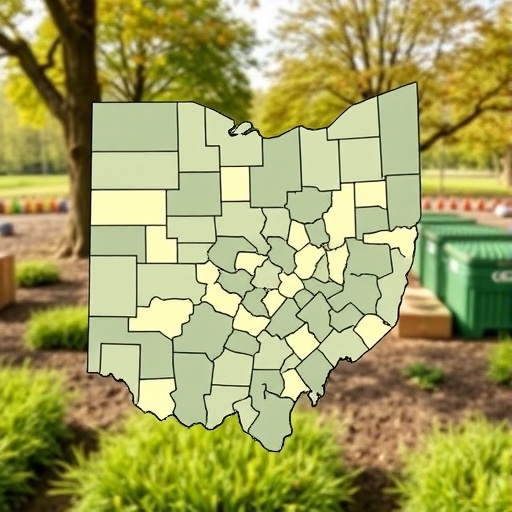
A new analysis of food-assistance data from Ohio’s 88 counties has found a striking rural–urban divide in participation in the Supplemental Nutrition Assistance Program, or SNAP. Rural counties recorded participation rates 13.4 percentage points higher than non-rural counties between 2010 and 2019, even after researchers accounted for poverty, unemployment, education, demographics and industry composition. The difference was statistically significant at the 1 percent level, indicating that it was unlikely to have arisen from random variation in the sample. The finding challenges simple assumptions that urban areas, where poverty is often more visible and concentrated, necessarily have greater reliance on public food assistance. Instead, the study suggests that rural communities may have both higher underlying need and distinctive social and economic conditions that shape whether eligible residents enroll in SNAP.
The study, published in the Atlantic Economic Journal, revisits earlier research from Pennsylvania that identified important differences in SNAP participation between rural and urban counties. Ohio offered a useful test because it contains a more balanced mixture of rural and non-rural counties: 47 of its 88 counties were classified as rural during the analysis, compared with 48 rural counties among Pennsylvania’s 67 counties. Ohio also combines Appalachian communities, large urban centers and economies shaped by manufacturing and post-industrial change. Nearly 2.8 million Ohio residents live in rural counties, giving the state one of the largest rural populations in the United States. By examining a neighboring state with similar but not identical characteristics, the researchers sought to determine whether the Pennsylvania pattern reflected a broader regional phenomenon or merely the conditions of one state.
To investigate the difference, Tuyen Pham, Christian Swart and G. Jason Jolley assembled annual county-level data covering 2010 through 2019. The dependent variable was each county’s SNAP participation rate, while the explanatory variables included poverty, unemployment, educational attainment, age structure, racial composition and employment in different industries. The researchers excluded data from 2020 onward because the COVID-19 pandemic disrupted employment, household finances and public-benefit behavior on an unprecedented scale. Including those years could have made it difficult to distinguish long-standing rural–urban patterns from temporary effects associated with the pandemic, emergency assistance and changes in economic activity.
The statistical model was designed not only to compare rural and non-rural counties, but also to test whether the same social and economic pressures had different effects in the two settings. At its core, the model estimated SNAP participation as a function of a rural-county indicator, a set of changing county characteristics, interactions between rural status and those characteristics, year-fixed effects and an error term. The interaction terms are particularly important: for a non-rural county, the effect of a variable is represented by its ordinary coefficient, whereas in a rural county the effect is the sum of that coefficient and the rural interaction coefficient. This allows, for example, unemployment or low education to have a different relationship with SNAP participation in a rural county than in an urban one.
Year-fixed effects helped account for influences that affected all Ohio counties in a particular year, including national policy changes and broad economic shocks. The researchers also clustered errors at the county level, a technique that addresses serial correlation when observations from the same county are followed repeatedly over time. Without that adjustment, statistical tests could exaggerate the apparent precision of the results because conditions in a county during one year are not independent of conditions in the next. The model explained a large share of the observed variation in county participation rates, with an R² value of 0.87. That does not prove that every factor affecting SNAP use was captured, but it indicates that the included variables collectively tracked substantial differences across counties and years.
The rural advantage remained after the analysis controlled for measurable socioeconomic conditions. Rural Ohio counties had a SNAP participation rate 13.4 percentage points higher than non-rural counties, with a probability value below 0.01. In practical terms, the result means that two counties with comparable measured poverty, unemployment, demographic composition, educational attainment and industry mix could still differ substantially in SNAP participation simply because one was rural and the other was not. The estimate should not be interpreted as evidence that rural residents are inherently more dependent on food assistance. Rather, it points to geographic conditions, institutional access, social norms or unmeasured economic characteristics that may influence the movement from eligibility to actual enrollment.
Across Ohio as a whole, several familiar indicators of economic hardship were strongly associated with higher SNAP participation. Counties with higher poverty and unemployment rates tended to have greater use of the program, while counties with lower educational attainment also showed higher participation. These relationships are consistent with SNAP’s role as a means-tested support program: as household resources fall and joblessness rises, more residents are likely to meet eligibility requirements or need help purchasing food. At the same time, the study found that counties with a larger share of younger residents and a larger manufacturing workforce tended to have lower participation rates. Those associations do not necessarily mean that young people or manufacturing employment reduce food insecurity. They may instead reflect differences in household structure, wages, benefit eligibility, labor-market stability or the demographic composition of counties.
The analysis also revealed that rural context altered the relationship between demographic characteristics and participation. Older adults aged 65 and over and people without a high school diploma were less likely to participate in SNAP in rural regions than their urban counterparts, even when other observed characteristics were held constant. The researchers suggest that stigma may help explain this pattern. In smaller communities, applying for or receiving public assistance may be more visible, potentially discouraging eligible residents from enrolling. Limited transportation, fewer social-service offices, reduced broadband access and weaker connections to outreach organizations could also make application and recertification more difficult, although the model was not designed to measure each of those mechanisms directly.
The findings broadly echo the Pennsylvania study that motivated the research, while also sharpening the policy challenge. If rural counties have higher participation overall but some vulnerable rural groups participate at lower rates than comparable urban residents, then a single statewide strategy may miss important barriers. The authors point to targeted workforce development and digitalization efforts, including community outreach, as possible ways to connect people experiencing hardship with assistance. Such measures could include more effective information delivery and easier access to enrollment services, although the study itself does not test particular interventions or establish which would be most successful. Increasing participation among eligible households matters beyond food budgets: previous research cited by the authors has linked SNAP access with reduced hunger and broader economic benefits for states.
Ohio’s political landscape limited what the researchers could say about another possible influence on SNAP participation: party control of state government. Republicans controlled the governorship, State Senate and State House for nearly the entire study period from 2011 through 2019, leaving too little variation to identify a reliable partisan effect. Consequently, political control was omitted from the explanatory model rather than treated as if it could be meaningfully estimated. The study also could not examine trends before 2010 because comparable explanatory variables were unavailable for earlier years. Those limitations mean the results describe a defined decade rather than a complete historical trajectory. Even so, the consistency of the Ohio findings with earlier evidence from Pennsylvania strengthens the case that rural–urban differences in SNAP enrollment are not merely a statistical curiosity. They may reflect persistent differences in need, access and social attitudes—differences that policymakers will need to understand if food-assistance programs are to reach all eligible households.
Cite Scienmag News
Courtney Benton. (August 27, 2026). Study Reexamines Rural-Urban SNAP Participation Differences Across Ohio Counties. Scienmag. https://scienmag.com/study-reexamines-rural-urban-snap-participation-differences-across-ohio-counties/
Courtney Benton. "Study Reexamines Rural-Urban SNAP Participation Differences Across Ohio Counties." Scienmag, 27 August 2026, https://scienmag.com/study-reexamines-rural-urban-snap-participation-differences-across-ohio-counties/. Accessed 3 September 2026.
Courtney Benton. "Study Reexamines Rural-Urban SNAP Participation Differences Across Ohio Counties." Scienmag. August 27, 2026. https://scienmag.com/study-reexamines-rural-urban-snap-participation-differences-across-ohio-counties/


