


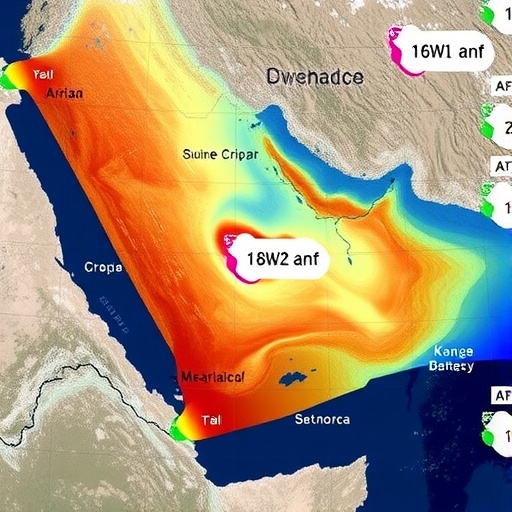
One of the fastest-warming seas on Earth is set to become dramatically hotter still, according to a new study that combines three decades of satellite observations with the latest generation of climate models. The research, published in the journal Ocean Dynamics, finds that sea surface temperatures in the Arabian Gulf, with a particular focus on the coastal waters of Qatar, have been rising at roughly twice the global average rate, and could climb by as much as five degrees Celsius by the end of the century under a high-emission future.
The study, led by Cheriyeri Poyil Abdulla of the Environmental Science Center at Qatar University, together with colleagues from Qatar University and Kuwait University, analyzed sea surface temperature, or SST, over the 30-year period from 1994 to 2023. The team drew on data from the Advanced Very High-Resolution Radiometer, known as AVHRR Pathfinder Version 5.3, a satellite instrument suite that has been measuring ocean temperatures since the 1980s. By using only the nighttime SST product, which is not contaminated by solar heating of the sea’s uppermost skin layer, the researchers obtained a more faithful record of true surface conditions across the Gulf.
The numbers that emerged are striking. Across eight carefully chosen analysis stations, four distributed along the main north–south axis of the Gulf and four within Qatar’s Exclusive Economic Zone, the warming trends ranged from 0.0217 to 0.0336 degrees Celsius per year. The average across all stations was approximately 0.028 degrees Celsius per year, a rate substantially higher than the recent global average of about 0.018 degrees Celsius per year and far above the long-term Indian Ocean trend of roughly 0.015 degrees Celsius per year between 1951 and 2015. In the adjacent Sea of Oman, warming rates are lower, in the range of 0.010 to 0.030 degrees Celsius per year, a contrast the researchers attribute to the Gulf’s distinctive physical geography.
The Gulf is, in many respects, an ideal laboratory for studying extreme ocean warming. It is a semi-enclosed, shallow marginal sea, roughly 1,000 kilometers long and 200 to 300 kilometers wide, connected to the Arabian Sea only through the narrow Strait of Hormuz. Its average depth is just 35 meters, and much of the Arabian side is shallower than 20 to 35 meters, fringed by broad tidal flats and salt flats known as sabkhas. This shallow bathymetry gives the basin a low thermal inertia, meaning the water column responds rapidly to atmospheric forcing. Combined with high evaporation rates, limited exchange with the open Indian Ocean, and a long water residence time estimated at three to five years, these characteristics make the Gulf exceptionally sensitive to long-term warming and amplify surface temperature signals.
The station-based analysis also revealed a clear spatial pattern. Warming was strongest at the northern stations and along the northern coast of Qatar, with the station labeled Q1 near Qatar’s north coast showing the highest trend of the entire dataset, even exceeding that of an offshore central Gulf station. The lowest trend was found in the southern Gulf. This latitudinal gradient is consistent with previous studies, including work showing that the shallow waters of Kuwait Bay warmed at about 0.06 degrees Celsius per year between 1985 and 2002. Shallower waters, with their reduced heat storage capacity, appear to respond more intensely to the changing atmosphere above them.
The 30-year record was not one of uniform warming. The researchers identified two contrasting subperiods: a cooling phase between 1998 and 2007, when trends ranged from about −0.064 to −0.098 degrees Celsius per year, followed by a period of accelerated warming from 2014 to 2023, with trends ranging from 0.046 to 0.075 degrees Celsius per year. The team notes that decadal climate modes and large-scale variability may contribute to these fluctuations, although such relationships were not directly assessed. They also point to recent regional research suggesting that weakened summer winds and reduced heat exchange with the Sea of Oman can enhance heat retention within the Gulf, while stronger temperature anomalies in recent years have been linked to lateral heat fluxes through the Strait of Hormuz.
To look into the future, the team turned to the Coupled Model Intercomparison Project Phase 6, or CMIP6, the ensemble of global climate models that underpins international climate assessments. Eleven models were selected, including AWI-CM-1-1-MR, CESM2-WACCM, CMCC-CM2-SR5, FIO-ESM-2-0, MPI-ESM1-2-HR, and others. Because these models operate on grids with minimum spatial resolutions of about 100 kilometers, much coarser than the satellite data, the researchers regridded all outputs onto a common 0.25-degree grid, using ordinary kriging for the unstructured grid of one model and bilinear interpolation for the rest. Model performance was then quantified using bias, root mean square error, correlation coefficient, and a skill score that compares model error against the observed variability itself.
This marked the first time CMIP6 SST output had been rigorously evaluated against observations in the Gulf. The results were broadly encouraging. Correlation coefficients between individual models and the satellite record ranged from 0.91 to 0.99, with p-values below 0.0001, and most models achieved skill scores above the commonly accepted threshold of 0.5. Five models, including FIO-ESM-2-0 and MPI-ESM1-2-HR, exceeded 0.7, with the latter two surpassing 0.8. Performance was generally best in the central Gulf; in the north, cool freshwater outflow from the Shatt al-Arab river and stronger Shamal wind influence complicate the picture, while in the south, the immense Rub’ al-Khali desert shapes local atmospheric conditions. The multi-model mean reproduced the observed seasonal cycle with correlations of 0.98 to 0.99 and skill scores between 0.76 and 0.84, though it exhibited a slight negative bias, suggesting the models modestly underestimate Gulf temperatures. The authors caution that these metrics are dominated by the strong seasonal cycle and recommend future evaluations using de-seasonalized anomalies to probe interannual variability.
With the models validated, the team generated projections under two scenarios: SSP2-4.5, a moderate-emissions pathway, and SSP5-8.5, a high-emissions pathway. By 2100, the projections indicate SST increases of 1.95 to 2.19 degrees Celsius under the moderate scenario, and 4.53 to 5.04 degrees Celsius under the high-emissions scenario, relative to 2015. The corresponding mean warming trends are approximately 0.024 degrees Celsius per year under SSP2-4.5 and 0.056 degrees Celsius per year under SSP5-8.5, which is more than double the moderate rate and roughly double the historical rate observed over the past three decades. At the northern station G1, the high-emissions scenario implies a rise of about 2.08 degrees Celsius by 2050, 3.56 degrees by 2075, and 5.04 degrees by 2100. Notably, the historical satellite trends already track closely with, and in some places slightly exceed, the moderate-scenario projections, suggesting the Gulf is on a path consistent with sustained high emissions.
The ecological implications are profound. The Gulf’s corals already live at the thermal edge, enduring the highest average summer sea surface temperatures in the global ocean, along with extreme salinity. Major bleaching events in 1996, 1998, and 2002, during which mean SST exceeded long-term averages by more than 2 degrees Celsius, caused widespread coral mortality across the region, and recovery has been variable and often limited. Although Gulf coral communities are among the most thermally tolerant on Earth, the projected multi-degree rise in annual mean SST represents a fundamental shift in the thermal baseline. Recent studies have linked strong regional warming and increasingly frequent marine heatwaves to declining biological productivity and severe ecosystem impacts, and the new projections suggest that both the frequency and intensity of bleaching events are likely to increase.
The study also quantified the atmospheric forces behind the Gulf’s temperature swings. Using multiple linear regression with annual mean air temperature and wind speed as predictors, the researchers found that air temperature is the dominant driver of SST, with regression coefficients of 0.76 to 0.99 degrees Celsius of SST change per 1 degree Celsius of air temperature change, and correlations between SST and air temperature of 0.84 to 0.87. This tight coupling reflects the basin’s shallowness and limited heat storage capacity, which allow atmosphere–ocean heat exchange to effectively dictate surface water temperature. Wind speed showed a consistent but weaker negative association, with coefficients ranging from −0.23 to −0.50 degrees Celsius per meter per second of wind increase. The physical explanation is straightforward: stronger winds enhance vertical mixing and evaporative cooling, both of which lower surface temperatures, while weak winds allow heat to accumulate. The regression models were highly significant, with F-statistics between 38.7 and 66 and R² values of 0.74 to 0.83, meaning the two predictors together explain most of the year-to-year SST variability.
The authors acknowledge limitations, including the influence of the seasonal cycle on model evaluation metrics, the absence of an inter-model spread analysis, and the restriction of the attribution analysis to just two predictors, omitting surface heat flux components and oceanic heat exchange through the Strait of Hormuz. Even so, the convergence of satellite observations and climate model projections on a warming trajectory of at least two degrees Celsius by 2100, even under moderate emissions, sends an unambiguous signal. For a shallow, semi-enclosed sea whose reefs, fisheries, and coastal economies are already living at the limits of thermal tolerance, the study underscores an urgent need for regional adaptation strategies to protect one of the world’s most vulnerable marine environments.
Cite Scienmag News
Violet Maxwell. (September 4, 2026). Satellite data and climate models reveal Arabian Gulf warming trends. Scienmag. https://scienmag.com/satellite-data-and-climate-models-reveal-arabian-gulf-warming-trends/
Violet Maxwell. "Satellite data and climate models reveal Arabian Gulf warming trends." Scienmag, 4 September 2026, https://scienmag.com/satellite-data-and-climate-models-reveal-arabian-gulf-warming-trends/. Accessed 4 September 2026.
Violet Maxwell. "Satellite data and climate models reveal Arabian Gulf warming trends." Scienmag. September 4, 2026. https://scienmag.com/satellite-data-and-climate-models-reveal-arabian-gulf-warming-trends/


