


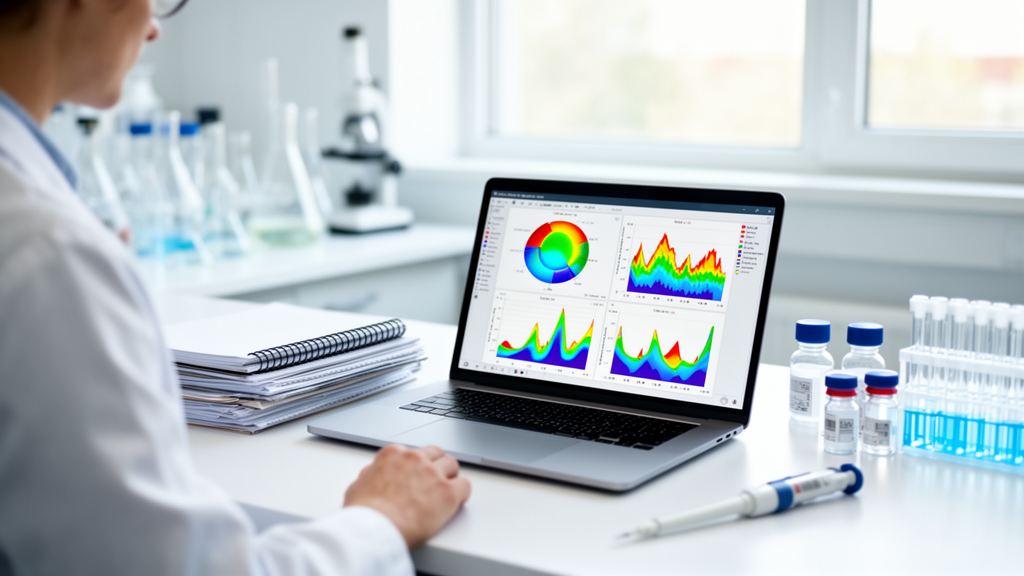
Research laboratories are under growing pressure to account for their environmental footprint, and a new open-source tool aims to make that task dramatically easier. In a study published in PLOS Sustainability and Transformation, William V. Smith and Stefan R. Pulver introduce WillCO2st, a free program that generates publication-ready sustainability reports for scientific experiments in a matter of minutes. The software addresses a persistent gap in research sustainability: while institutions and funders increasingly demand emissions accounting from their scientists, the tools available for measuring the electricity-related emissions of laboratory work have remained cumbersome, expensive, or simply absent.
The problem the researchers set out to solve is rooted in the way carbon accounting frameworks classify emissions. Electricity consumed by a laboratory falls under so-called scope 2 emissions, the indirect emissions generated when power is produced elsewhere and delivered to the building. For energy-intensive facilities such as laboratories, which run freezers, incubators, centrifuges, and high-performance computing equipment around the clock, scope 2 accounting can represent a substantial share of the total carbon footprint. Yet despite the rapid rollout of auditing processes such as the Laboratory Efficiency Assessment Framework, known as LEAF, and shifting institutional policies, easy-to-use and accurate reporting tools for this category of emissions have not been widely available to individual researchers.
WillCO2st takes an unusually pragmatic approach to closing that gap. The program draws on real-time, region-specific conversion factor data that are freely available through resources such as the Carbon Intensity API and the Electricity Maps API. These services track the carbon intensity of electricity grids as it fluctuates throughout the day, reflecting the changing mix of wind, solar, nuclear, and fossil fuel generation feeding the grid at any given moment. By combining this live grid data with metadata extracted from saved experimental files, the software can produce experimental carbon footprint estimates that reflect not just how much electricity an experiment consumed, but when that electricity was used and how clean the grid happened to be at that time.
The workflow is deliberately simple. Researchers can click and drag their data files directly into WillCO2st, and the program generates an experimental sustainability audit within minutes. That speed matters in a field where sustainability reporting has often been delegated to specialist sustainability officers or outsourced to consultants, adding time and cost that many research groups cannot spare. By automating the conversion of raw experimental metadata into a formatted report, the tool eases what the authors describe as the time and resource burden on researchers, allowing them to produce documents suitable for institutional submissions without specialized training in carbon accounting.
One of the most intriguing features of the software is what the authors call live nudging. Because the tool knows the carbon intensity of the local grid at different times of day, it can identify windows during which running the same experiment would produce fewer emissions. The researchers demonstrated this capability by quantifying the retrospective, theoretical reduction in electricity-driven emissions that would have been achieved simply by shifting experimental timing to periods of lower carbon intensity. In grids where solar generation peaks at midday or wind output surges overnight, the difference between running an energy-hungry protocol at a high-carbon hour and a low-carbon hour can be significant, and the software makes those differences visible and actionable.
The significance of this timing-based approach extends beyond individual laboratories. Electricity grids around the world are becoming more dynamic as renewable generation expands, which means the carbon cost of a kilowatt-hour is no longer a fixed number but a moving target that varies by hour and by region. Traditional carbon accounting often relies on annual average conversion factors, which smooth over these fluctuations and obscure opportunities for demand shifting. By using real-time, region-specific data instead, WillCO2st aligns research emissions reporting with the way modern grids actually operate, and it positions scheduling as a legitimate emissions-reduction strategy alongside equipment upgrades and energy-efficiency measures.
The broader context for the tool is a wave of institutional change sweeping through the research sector. Funding bodies and universities are making sustainability a focal point, and auditing frameworks such as LEAF are being rolled out rapidly across laboratories in the United Kingdom and beyond. These processes create demand for sustainability accounting at the level of the individual researcher, not just the institution. Until now, meeting that demand has often required researchers to assemble estimates manually, piecing together electricity consumption figures, conversion factors, and reporting templates on their own. WillCO2st serves, in the authors’ words, as a model for how researchers can effectively and accurately engage with research sustainability auditing.
The authors are careful to describe the tool’s estimates as experimental, an honest caveat that reflects the inherent uncertainty in combining file metadata with live grid data. Real-time carbon intensity figures themselves carry uncertainties, since grid operators model the fuel mix rather than measure every generator directly, and the electricity consumption inferred from experimental files may not capture every device involved in a workflow. Even so, the approach represents a meaningful advance in accessibility. A researcher who previously had no practical way to estimate the scope 2 emissions of an experiment can now drag a file into a program and receive a formatted, region-aware audit, with all of the underlying conversion data drawn from freely available public sources.
What makes WillCO2st potentially viral among laboratory scientists is the combination of zero cost, minimal effort, and immediate output. Sustainability reporting has traditionally been perceived as an administrative chore imposed from above, but a tool that produces a report in minutes from files a researcher already has lowers the barrier to participation to nearly nothing. The live-nudging feature adds an element of gamification as well, inviting scientists to compete against their own past emissions by rescheduling work toward cleaner hours of the grid. If widely adopted, such behavioral shifts could aggregate into meaningful demand-side reductions, particularly in research clusters located on grids with strong daily swings in renewable output.
The study ultimately frames sustainability auditing not as a burden but as an opportunity for the research community to lead by example. By demonstrating that accurate, real-time carbon footprinting can be fast, free, and built on open data, Smith and Pulver offer a template that other disciplines and institutions could adapt. As funders continue to tie sustainability performance to research assessment, tools of this kind are likely to move from novelty to necessity, and the laboratories that adopt them early may find themselves ahead of both the regulatory curve and the climate one.
Subject of Research: Real-time carbon intensity forecasting for research laboratory electricity emissions reporting
Article Title: WillCO 2 st: leveraging freely available real-time carbon forecasting for research emissions reporting
Article References: Smith, W. V., & Pulver, S. R. (2026). WillCO2st: leveraging freely available real-time carbon forecasting for research emissions reporting. PLOS Sustainability and Transformation, 5(7), e0000257. https://doi.org/10.1371/journal.pstr.0000257
Image Credits: AI Generated
DOI: 10.1371/journal.pstr.0000257
Keywords: carbon accounting, scope 2 emissions, laboratory sustainability, carbon intensity, electricity maps, real-time forecasting, research emissions, LEAF framework, open-source software, energy demand shifting, grid decarbonization, sustainability reporting
Cite Scienmag News
Sloane Callahan. (October 9, 2026). Free Tool Turns Saved Lab Files Into Real-Time Carbon Reports in Minutes. Scienmag. https://scienmag.com/free-tool-turns-saved-lab-files-into-real-time-carbon-reports-in-minutes/
Sloane Callahan. "Free Tool Turns Saved Lab Files Into Real-Time Carbon Reports in Minutes." Scienmag, 9 October 2026, https://scienmag.com/free-tool-turns-saved-lab-files-into-real-time-carbon-reports-in-minutes/. Accessed 9 October 2026.
Sloane Callahan. "Free Tool Turns Saved Lab Files Into Real-Time Carbon Reports in Minutes." Scienmag. October 9, 2026. https://scienmag.com/free-tool-turns-saved-lab-files-into-real-time-carbon-reports-in-minutes/


