Concrete in cold regions faces a relentless enemy: water that seeps into its pores, freezes, expands, and thaws again, cycle after cycle, slowly tearing the material apart from within. A new open-access study published in October 2026 in the journal Discover Concrete and Cement presents an integrated experimental and numerical framework that makes this hidden deterioration process visible in three dimensions, combining rapid freeze–thaw laboratory testing, X-ray computed tomography (CT) scanning, and finite element (FE) simulation into a single analytical pipeline.
The research team, led by Qixiang Xu and Gang Cheng along with Wei Xie and Xiaofei Cheng, set out to overcome a persistent limitation in freeze–thaw research. Traditional durability indicators such as mass loss, relative dynamic modulus of elasticity, and strength capture the macroscopic consequences of frost damage, but the mechanisms based on Darcy’s law and thermodynamic equilibrium principles have remained largely macroscopic explanations. It has been difficult to visualize what actually happens inside the concrete microstructure as damage accumulates. Existing experimental observations have seldom been directly linked to numerical simulations at the mesoscale, particularly for concrete containing heterogeneous aggregates and complex interfacial transition zones (ITZ), the weak regions that form around aggregate particles during concrete preparation.
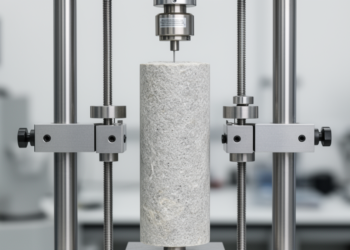
To build their framework, the researchers first conducted indoor rapid freeze–thaw tests following the fast freezing method specified in the Chinese standard GB/T 50082-2024. They used second-class concrete commonly employed in hydraulic construction, made with Zhonglian brand P-O 42.5 Portland cement, crushed basalt coarse aggregate with particle sizes ranging from 5 to 40 mm, and ordinary river sand. The actual water-cement ratio was 0.45, and the fresh concrete had a slump of 170 mm. Prism specimens measuring 100 mm by 100 mm by 400 mm served for mass loss and dynamic modulus measurements, while 100 mm cubes were used for compressive strength tests. Before testing, all specimens were immersed in water at 20 ± 2°C for 4 days to ensure full saturation, and during cycling they remained in water-filled boxes immersed in a freezing medium.
Each freeze–thaw cycle lasted 3 hours, with the specimen center temperature controlled between −18 ± 2°C and 5 ± 2°C. The freezing and thawing periods each took approximately 1.5 hours, and temperature transitions completed within 10 minutes. The team subjected 28-day-old specimens to 25, 50, 75, 100, 125, and 150 cycles, measuring dynamic modulus and strength every 25 cycles using a ZT801 rock parameter tester and a WAW-1000 electrohydraulic servo tester. The results showed a clear deterioration pattern: mass loss reached 1.16% at 100 cycles and 4.2% at 150 cycles, while the relative dynamic modulus decreased to 67.64% at 150 cycles. Specimen mass actually increased at first, as original pores and new micro-cracks absorbed more water and continuing hydration products added weight, before surface spalling drove losses upward. The relative dynamic elasticity modulus declined continuously, with the rate of decrease accelerating as internal cracks and defects expanded.
The visual damage told a parallel story. Cube specimens showed more severe peeling than prisms, because corners and edges experience freeze–thaw cycling in multiple directions with a wider temperature range. Surface roughness changed significantly, pits increased and became uneven, micro-cracks multiplied, and coarse aggregate gradually became exposed, producing spalling and localized chipping. Under the standard’s criteria, a specimen is considered completely damaged when the relative dynamic elastic modulus falls below 60% or mass loss exceeds 5%, thresholds the 0.45 water-cement ratio concrete approached but did not cross by 150 cycles.
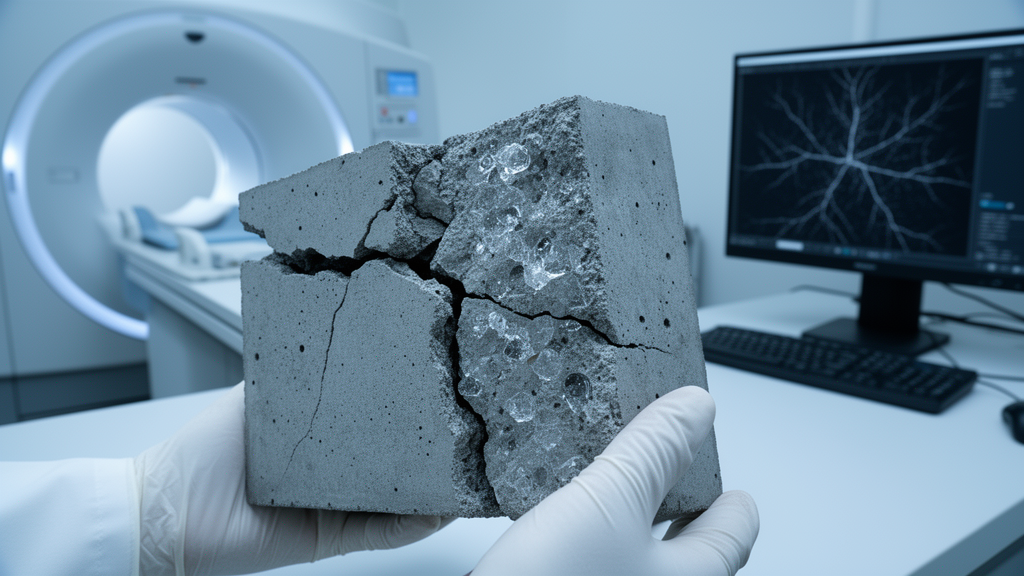
The heart of the study lay in the CT scanning campaign. The researchers scanned 50 mm cubic concrete samples after 0, 25, 50, 75, 100, and 125 freeze–thaw cycles, using a scanning interval of 0.035–0.036 mm that yielded 1,500 two-dimensional cross-sectional images per full scan within a 60-minute acquisition time. Because numerous fine aggregates and gray-level overlap from cement hydration products complicated phase boundary discrimination, the team pre-processed the CT slices and reconstructed them into a three-dimensional concrete model using Avizo software, employing a Python-based grayscale thresholding algorithm to segment aggregates, mortar, pores, and interfacial transition zones. The components were discretized into a finite element mesh, exported to Hypermesh for local repair and material property assignment, and prepared for numerical calculation. The reconstructed model accurately captured the size, morphology, and spatial distribution of the specimen’s internal constituents.
Because a CT-derived model is orders of magnitude smaller than the laboratory test chamber specimens, the researchers had to establish a representative volume element (RVE) capable of standing in for the full material. Dividing the same CT image into regions of different sizes and calculating weighted average elastic moduli, they found the data converged when side length exceeded approximately 8 mm, with relative changes of 1.8% from 7 to 8 mm and 0.9% from 8 to 9 mm. They selected a 9 mm unit cell as the minimum RVE size. At the scan’s 30 μm voxel resolution, such a model would contain 27 million voxel elements, an enormous computational burden, so they instead intercepted 27 non-overlapping sub-models of 3 mm by 3 mm by 3 mm, each containing 1 million elements. Statistical verification confirmed these sub-models faithfully represented the whole: average porosity was 3.52% with a standard deviation of 0.31 versus 3.48% for the overall model, a relative error of 1.15%, and pore connectivity averaged 0.179 versus 0.186, a 2.23% relative error. A K-S test on pore size distribution curves found no significant difference between sub-models and the overall model.
The CT analysis revealed the damage mechanism in striking quantitative detail. Initial porosity and pore volume stood at 1.6% and 80.8 mm³, consisting mainly of closed spherical pores. After 75 cycles, pore volume and pore ratio had increased by 14.9% and 50.6% respectively, with visible internal cracks forming around original pores. Before 50 cycles, pore volume and surface area grew at similar rates, but from 100 cycles porosity and pore volume jumped by 45.6% and 124.2%. The decisive signal came from pore surface area, which increased by 82.1%, 263.6%, and 411.0% at 75, 100, and 125 cycles compared to the unfrozen baseline. Because surface area growth vastly outpaced volume growth, the researchers concluded that microcrack widening rather than pore nucleation dominates damage progression beyond 75 cycles. Pores in the 20–50 μm range increased while those around 100 μm decreased, and mercury intrusion porosimetry revealed that CT scans, limited by their 30 μm voxel resolution, detected only about 65% of the MIP-measured pore volume at 100 cycles, underscoring the value of combining both techniques.
On the numerical side, the team built a coupled temperature-displacement FE model in ABAQUS version 2022, assigning the aggregate phase as linear elastic with a 70 GPa modulus, Poisson’s ratio of 0.25, and 4.5 MPa tensile strength, while the mortar matrix and ITZ followed an isotropic damage plasticity model governed by the maximum principal stress criterion. The ITZ, modeled with solid continuum elements at reduced properties of 14 GPa elastic modulus and 1.6 MPa tensile strength, was set to 30 μm thickness based on SEM measurements. Ice crystallization pressure entered the model through an equivalent volumetric expansion approach, with frozen water fractions calculated via the Gibbs–Thomson equation and the 9% volume expansion of water-to-ice phase change applied as eigenstrain to pore elements. Both numerical predictions and experimental CT observations consistently identified the interfacial transition zone as the critical damage zone, validating the framework’s central claim. The authors note that rapid indoor freeze–thaw tests differ from actual field conditions and carry size effects, so results serve as a reference for engineering assessment, and future work should strengthen environmental factor simulation and ITZ-specific damage analysis from two-dimensional CT images.
Subject of Research: Experimental and numerical methods for visualizing freeze–thaw damage evolution in concrete microstructure using CT imaging and finite element simulation
Article Title: CT image-based experimental and numerical simulation methods for freeze–thaw concrete microstructure
Article References: Xu, Q., Xie, W., Cheng, X., & Cheng, G. (2026). CT image-based experimental and numerical simulation methods for freeze–thaw concrete microstructure. Discover Concrete and Cement, 2(1), Article 84. https://doi.org/10.1007/s44416-026-00120-1
Image Credits: AI Generated
DOI: 10.1007/s44416-026-00120-1
Keywords: concrete, freeze-thaw cycles, computed tomography, finite element simulation, microstructure, interfacial transition zone, pore structure, durability, cold regions, damage evolution, representative volume element, mesoscale modeling
Cite Scienmag News
Denise Maddox. (October 28, 2026). CT scans and simulations reveal how freeze–thaw cycles crack concrete from the inside. Scienmag. https://scienmag.com/ct-scans-and-simulations-reveal-how-freeze-thaw-cycles-crack-concrete-from-the-inside/
Denise Maddox. "CT scans and simulations reveal how freeze–thaw cycles crack concrete from the inside." Scienmag, 28 October 2026, https://scienmag.com/ct-scans-and-simulations-reveal-how-freeze-thaw-cycles-crack-concrete-from-the-inside/. Accessed 28 October 2026.
Denise Maddox. "CT scans and simulations reveal how freeze–thaw cycles crack concrete from the inside." Scienmag. October 28, 2026. https://scienmag.com/ct-scans-and-simulations-reveal-how-freeze-thaw-cycles-crack-concrete-from-the-inside/