For patients with thymoma-associated myasthenia gravis, surgery on the chest is a delicate balancing act. The tumor itself may be small, but the autoimmune disorder it triggers can make the perioperative period dangerously unpredictable, with risks ranging from respiratory crises to prolonged intensive care stays. A team of researchers at Tianjin Medical University General Hospital in China has now asked a deceptively simple question: can the texture of a thymoma and the tissue immediately surrounding it, as seen on a routine computed tomography scan, reveal which patients are most likely to suffer complications after surgery? Their answer, published in BMC Medical Imaging, is a carefully qualified yes with an important caveat.
The study, led by Yongjia Chai and Chao Lu as co-first authors under the corresponding authorship of Peng Zhang, took a retrospective look at 145 patients who underwent treatment for thymoma-associated myasthenia gravis. Of these, 37 experienced what the researchers defined as a composite perioperative outcome during their hospital stay. Rather than relying on the radiologist’s naked eye, the team turned to radiomics, a technique that converts medical images into vast arrays of quantitative features, capturing patterns of intensity, texture, and shape that are invisible to human observers. The central innovation of the work, however, was not the machine learning model itself but a question about geography: how much of the tissue around the tumor should the algorithm be allowed to see?
This question matters more than it might first appear. In oncological imaging, there is growing recognition that tumors do not exist in isolation. The peritumoral microenvironment, the zone of tissue immediately bordering a lesion, often carries biological information about invasion, inflammation, and host response. In thymoma-associated myasthenia gravis, this is particularly intriguing, because the disease process involves the immune system reacting to the thymic tumor in ways that may leave detectable traces in the surrounding mediastinal fat and soft tissue. But there is a trade-off. Define the region of interest too narrowly, and you miss the environmental signal. Define it too broadly, and you dilute it with irrelevant anatomy and noise.
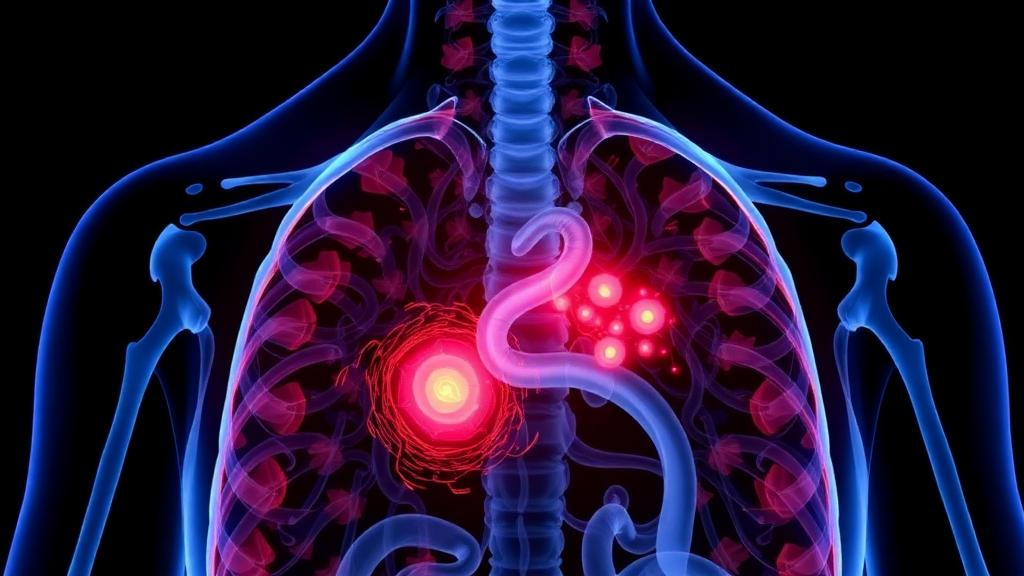
To resolve this, the researchers constructed five different three-dimensional representations of each tumor. The first captured only the intratumoral volume, the tumor itself. Three others extended the analysis outward by physical distances of one, three, and five millimeters beyond the tumor boundary, creating peritumoral shells of increasing thickness. The fifth and most novel representation, dubbed VOIFusion3mm, integrated the tumor volume together with its three-millimeter peritumoral rim into a single combined region of interest. Each of these five spatial definitions was then subjected to the same radiomic pipeline, allowing a direct, head-to-head comparison of which spatial strategy carried the most predictive information.
The radiomic features extracted from each representation were fed into a radial-basis-function support vector machine, a classical machine learning classifier well suited to high-dimensional data with modest sample sizes. To guard against the pervasive problem of overfitting, the team employed a rigorous validation scheme: five-fold nested cross-validation, repeated ten times. In nested cross-validation, an inner loop selects the model’s hyperparameters while an outer loop evaluates performance on data the model has never seen, producing what the authors call out-of-fold predictions. Repeating the entire procedure ten times yields a distribution of performance estimates rather than a single, potentially lucky number. Feature selection was performed using the least absolute shrinkage and selection operator, or LASSO, a regularization method that shrinks irrelevant features to zero.
The results were statistically clear, even if the effect was modest. The integrated tumor-plus-three-millimeter representation achieved the highest mean repeat-level out-of-fold area under the receiver operating characteristic curve, an AUC of 0.628 with a 95 percent confidence interval spanning 0.544 to 0.714. By comparison, the intratumoral representation managed only 0.536 and the isolated three-millimeter peritumoral shell 0.533, both barely better than a coin flip. The difference between the fused representation and its competitors was meaningful: an AUC advantage of 0.092 over the intratumoral approach and 0.095 over the isolated peritumoral one, with confidence intervals that excluded zero and false-discovery-rate corrected p-values, reported as q-values, of 0.009 and 0.015 respectively. These comparisons were prespecified and tested using 2,000 patient-cluster bootstrap resamples, a robust approach that respects the paired nature of the data.
Perhaps the most fascinating finding concerned the sensitivity of the model to where exactly the tumor boundary was drawn. When the researchers eroded the fused region inward by one millimeter, shaving off the outermost layer of the analysis volume, the mean AUC dropped by 0.093, a substantial and statistically significant decline with a confidence interval of negative 0.169 to negative 0.015. Yet when they dilated the region outward, expanding it beyond the tumor plus three millimeters, performance barely changed, shifting by only negative 0.004. This asymmetry is telling. It suggests that the predictive signal is concentrated in a thin band of tissue hugging the tumor, and that once that band is included, adding more distant tissue contributes nothing. The information lives at the interface, not in the surrounding mediastinum at large.
The team also subjected their pipeline to a battery of stress tests. Feature-exclusion analyses and a no-LASSO variant, in which feature selection was skipped entirely, both left the fused three-millimeter representation ranked highest, indicating that the result was not an artifact of a particular feature selection step. However, two sobering findings tempered the enthusiasm. First, when the radiomic model was compared against a prespecified clinical model built from conventional patient characteristics, the imaging features added no incremental discriminatory power. Second, the calibration of the radiomic model, meaning the agreement between predicted probabilities and observed event rates, was limited, which is a critical shortcoming for any tool intended to estimate individual patient risk.
The authors are admirably candid about these limitations. An AUC of 0.628, while statistically distinguishable from the alternatives, represents only weak discrimination in absolute terms and falls well short of what would be needed for clinical decision-making. The study was conducted at a single center, raising questions about whether the segmentation protocols, imaging parameters, and patient characteristics would generalize elsewhere. The number of outcome events, 37, is small relative to the dimensionality of radiomic data, which constrains statistical power and model stability. The researchers also note the absence of an independent multi-reader assessment of segmentation reproducibility, meaning that variability in how different observers delineate tumor boundaries was not formally quantified. Given all of this, they explicitly state that VOIFusion3mm should not guide individual perioperative decisions and remains a candidate representation requiring external validation.
Even with these caveats, the study makes a genuine contribution to a rapidly evolving field. It demonstrates, with methodological rigor that is still too rare in radiomics research, that the spatial definition of the region of interest is not a technical afterthought but a first-order determinant of predictive performance. The finding that a three-millimeter peritumoral rim, fused with the tumor itself, outperforms both the tumor alone and the peritumoral shell alone offers a concrete design principle for future studies of thymic and possibly other thoracic tumors. It also hints at biology: the interface between a thymoma and its host tissue appears to encode information relevant to perioperative risk, consistent with the idea that the tumor microenvironment shapes clinical behavior. For now, the algorithm stays in the laboratory, but the message for the field is clear. When machines read medical images, what they are allowed to look at matters as much as how they look, and the most informative territory may lie precisely at the border between the tumor and everything else.
Subject of Research: CT radiomics of tumor and peritumoral regions for predicting perioperative outcomes in thymoma-associated myasthenia gravis
Article Title: Integrated tumor–peritumoral CT radiomics for perioperative event discrimination in thymoma-associated myasthenia gravis: a retrospective cohort study
Article References: Integrated tumor–peritumoral CT radiomics for perioperative event discrimination in thymoma-associated myasthenia gravis: a retrospective cohort study. (n.d.). https://doi.org/10.1186/s12880-026-02924-w
Image Credits: AI Generated
DOI: 10.1186/s12880-026-02924-w
Keywords: radiomics, computed tomography, thymoma, myasthenia gravis, peritumoral region, machine learning, support vector machine, perioperative outcomes, cross-validation, feature selection, tumor microenvironment, BMC Medical Imaging
Cite Scienmag News
Ophelia Keating. (October 14, 2026). AI Reads the Tumor and Its Surroundings to Predict Surgery Risks in Thymoma Patients. Scienmag. https://scienmag.com/ai-reads-the-tumor-and-its-surroundings-to-predict-surgery-risks-in-thymoma-patients/
Ophelia Keating. "AI Reads the Tumor and Its Surroundings to Predict Surgery Risks in Thymoma Patients." Scienmag, 14 October 2026, https://scienmag.com/ai-reads-the-tumor-and-its-surroundings-to-predict-surgery-risks-in-thymoma-patients/. Accessed 14 October 2026.
Ophelia Keating. "AI Reads the Tumor and Its Surroundings to Predict Surgery Risks in Thymoma Patients." Scienmag. October 14, 2026. https://scienmag.com/ai-reads-the-tumor-and-its-surroundings-to-predict-surgery-risks-in-thymoma-patients/