Every minute a patient spends in the intensive care unit after cardiac surgery generates a stream of numbers that most hospitals simply store and forget. Arterial lines feed continuous blood pressure readings into electronic health records, creating vast archives of physiological data that could transform how researchers understand the link between blood pressure and postoperative complications. Now, a team at Vanderbilt University Medical Center has built a reusable pipeline that turns this raw, messy, minute-by-minute data into clean, research-ready blood pressure profiles, and their approach could reshape how perioperative medicine is studied worldwide.
The research, published in the Journal of Medical Systems, tackles a deceptively hard problem. Decades of literature have established that mean arterial pressure, or MAP, during and after surgery is associated with serious adverse outcomes, including acute kidney injury and myocardial damage. But almost all of those studies relied on simplified summaries of blood pressure exposure: time-weighted averages, minutes spent below an arbitrary threshold, or the lowest reading recorded in a 24-hour window. Each of those metrics bakes in assumptions that may be wrong, and each one smooths away the rapid fluctuations that clinicians actually see at the bedside.
The Vanderbilt team, led by Gen Li and David R. McIlroy in the Department of Anesthesiology, together with Robert E. Freundlich and biostatistician Benjamin French, reviewed how previous studies handled blood pressure data across cardiac and non-cardiac surgery settings. They found a recurring pattern of rigid shortcuts. One common technique, Last Observation Carried Forward, simply copies the last available reading across any gap in the record. Another, linear interpolation, draws a straight line between two known points. Both approaches erase the very variability that may matter most for patient outcomes, and both can introduce bias into exposure estimates.
Their solution begins with data extraction from the ArchiveVital database, a system hosted by Vanderbilt’s Health IT division that captures high-frequency vital signs directly from bedside monitors. For each of 1,368 cardiac surgery patients, the team extracted minute-by-minute MAP values covering the first 24 hours in the ICU, a window that yielded nearly 1.9 million person-minutes of data. Because electronic health records often store the same measurement under different names in different tables, the pipeline pulled from two continuous flowsheet rows, arterial line and arterial blood pressure readings, and supplemented them with manually charted nursing entries recorded at less frequent intervals.
The cleaning stage is where the pipeline earns its technical credentials. Values below 30 or above 150 mmHg were discarded as physiologically implausible. When multiple readings appeared within a single minute from the same source, the median was assigned. Any rolling 15-minute period showing no variation at all was scrutinized: a single repeated value was kept, but multiple identical values were treated as a sensor artifact and set to missing. Isolated outliers deviating more than 50 percent from both the preceding and following minutes were flagged and excluded. When the two continuous sources disagreed at the same timestamp, the higher value was retained, a choice that mirrors how clinicians actually make decisions at the bedside. After all filtering, more than 1.3 million minute-level MAP readings survived, and nursing flowsheet data filled in another 12,117 minutes.
Even after this aggressive cleaning, 30.7 percent of patient-minutes remained missing, the result of arterial line removal or dysfunction, patient transport for diagnostic procedures, early ICU discharge, or simple technical failures in data transfer. Rather than filling these gaps with naive interpolation, the team deployed a two-stage multiple imputation framework. First, chained-equations imputation generated five complete versions of the static patient-level variables, including demographics, clinical characteristics, and medications. Then, an algorithm combining the expectation-maximization method with bootstrapping imputed the time-dependent, minute-by-minute blood pressure series within each of those five datasets, repeating the process ten times to yield 50 fully imputed datasets. The approach was run in R using the mice and Amelia packages on Apache Spark infrastructure, a detail that signals the pipeline’s scalability to datasets far larger than this single-center cohort.
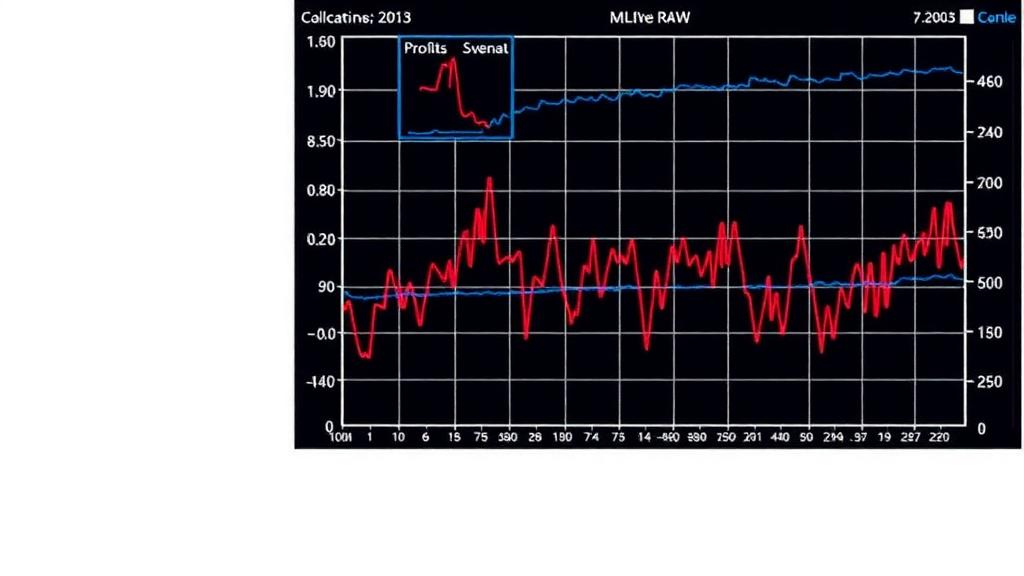
With complete profiles in hand, the team constructed the study’s signature contribution: longitudinal MAP profiles built from seven mutually exclusive blood pressure bands, ranging from below 55 mmHg up to 80 mmHg and above. The primary exposure metric was simply the total number of minutes each patient spent in each band across the first 24 postoperative hours. A secondary profile expressed each minute’s value as a percentage change from the patient’s preoperative baseline MAP, again sorted into seven bands. This design minimizes assumptions about how blood pressure behaves, letting the data speak in its own granularity rather than forcing it into a single summary number. It also gives future researchers operational flexibility, since any custom exposure metric can be recomputed from the same minute-level foundation.
Validation was rigorous and, unusually for a methods paper, empirically convincing. Diagnostic measures across the 50 imputed datasets showed between-imputation variance below 0.001, relative increases in variance between 0.015 and 0.037, and relative efficiency values near 1.000, indicating the final profiles were highly stable regardless of imputation uncertainty. The team then ran a stress test: they identified 300 patients with less than 10 percent missing data, artificially deleted 240 to 720 minutes of their observed readings, and re-imputed the gaps. Under mild data loss, the deviation in the distribution of time spent across the seven bands ranged from 0.5 to 2.5 percent; even under extreme data loss of 12 hours, it stayed between 0.8 and 3.2 percent. When fully observed segments were included, the maximum discrepancy shrank to a negligible 0.5 to 1.5 percent.
The implications extend well beyond cardiac surgery. The authors emphasize that their processing logic does not depend on proprietary hardware or a single electronic health record vendor, making the workflow transferable across institutions and vendor environments. Wireless, battery-powered vital sign monitors already entering ward use could extend continuous monitoring to patients who traditionally receive only intermittent checks, multiplying the data available for this kind of analysis. As hospitals increasingly invest in archiving high-frequency physiological data, pipelines like this one convert storage burdens into scientific assets, supporting both observational research and quality improvement initiatives at scale.
The team is candid about the limits. Missingness in the ICU is rarely random: early arterial line removal often signals clinical stability, while line dysfunction and patient transport tend to happen to sicker patients, and no imputation model can fully replicate that informative pattern. Collapsing minute-level records into cumulative band durations also sacrifices temporal sequence information, so a single sustained hypotensive episode looks identical to a series of scattered transient dips, and the framework does not yet distinguish early from late postoperative hypotension or account for vasoactive medication timing. Systematic measurement errors in the source records cannot be eliminated either. Even so, the study delivers what the field has lacked: a standardized, assumption-light, reproducible workflow for turning the noisy torrent of ICU monitor data into exposure metrics that preserve, rather than erase, the physiological story of each patient’s recovery.
Subject of Research: A data-processing and multiple imputation framework for high-frequency postoperative ICU arterial blood pressure data from electronic health records
Article Title: Leveraging High-Frequency Postoperative ICU Arterial Blood Pressure Data from Electronic Health Records for Research: A Brief Report
Article References: Leveraging High-Frequency Postoperative ICU Arterial Blood Pressure Data from Electronic Health Records for Research: A Brief Report. (n.d.). https://doi.org/10.1007/s10916-026-02472-4
Image Credits: AI Generated
DOI: 10.1007/s10916-026-02472-4
Keywords: electronic health records, mean arterial pressure, cardiac surgery, intensive care unit, multiple imputation, data cleaning, high-frequency physiological data, postoperative hypotension, acute kidney injury, clinical informatics, perioperative research, Vanderbilt University Medical Center
Cite Scienmag News
Ophelia Keating. (October 14, 2026). Minute-by-Minute ICU Blood Pressure Data Turned Into Research-Ready Profiles. Scienmag. https://scienmag.com/minute-by-minute-icu-blood-pressure-data-turned-into-research-ready-profiles/
Ophelia Keating. "Minute-by-Minute ICU Blood Pressure Data Turned Into Research-Ready Profiles." Scienmag, 14 October 2026, https://scienmag.com/minute-by-minute-icu-blood-pressure-data-turned-into-research-ready-profiles/. Accessed 14 October 2026.
Ophelia Keating. "Minute-by-Minute ICU Blood Pressure Data Turned Into Research-Ready Profiles." Scienmag. October 14, 2026. https://scienmag.com/minute-by-minute-icu-blood-pressure-data-turned-into-research-ready-profiles/