

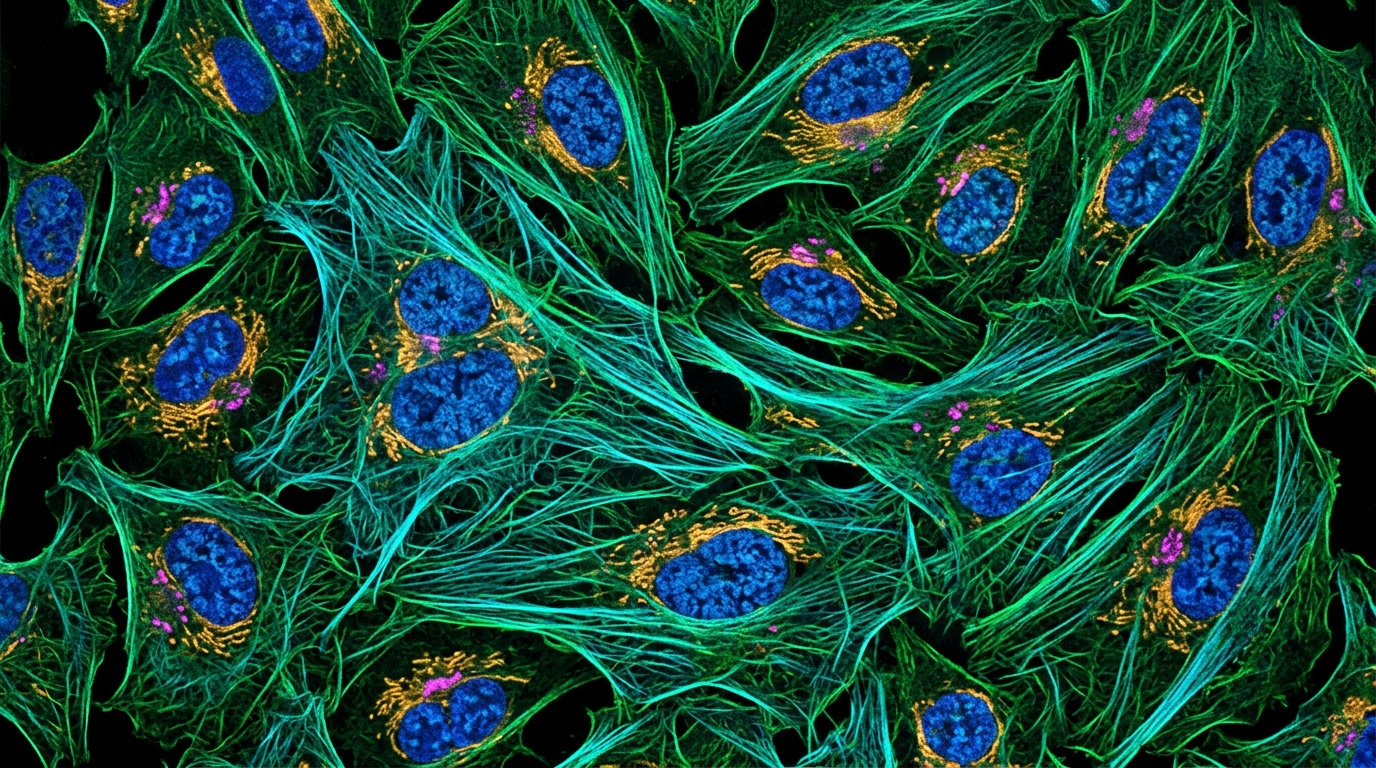
Computational cancer researchers often analyze large molecular profiling datasets to understand tumor biology, but relying solely on a single molecular layer frequently obscures critical cellular mechanisms. Cells organize their biological functions within distinct subcellular compartments and organelles, which supply specialized physical environments and molecular binding partners necessary for constituent proteins to operate properly. Malignancies involve extensive cellular perturbations, including somatic mutations, copy number aberrations, and significant shifts in transcriptomic and proteomic expression across varied tissues. While scientists routinely evaluate either messenger RNA or protein quantities across biological samples, transcriptomic and proteomic abundances frequently fail to correlate across diverse tumor contexts. This molecular divergence complicates the identification of true disease drivers and phenotypic mechanisms. To bridge these analytical gaps, computational tools must simultaneously integrate expression data across multiple omics layers while anchoring those molecular concentrations to specific subcellular locations, allowing investigators to track spatial shifts in protein distribution throughout malignant cells.
Addressing the limitations of conventional single-layer profiling, a computational research team introduced a web-based visual data mining system called the Location-wise Proteome/transcriptome Abundance Comparative Analyzer, abbreviated as ALPACA. Unlike traditional analytical packages that specialize solely in statistical calculations or generic visual charting, this platform maps whole-genome expression and quantitative proteomic data directly into compartmentalized subcellular domains. Subcellular protein distributions are known to shift dramatically between distinct disease states, yet experimentally testing every permutation across numerous cancer subtypes and cellular compartments remains prohibitively expensive and time-consuming. Most established bioinformatics tools, including command-line differential abundance suites like MSstatsTMT, TopPIC, and SDAMS, identify altered proteins from mass spectrometry data but present their outputs through terminal interfaces without spatial or pathway context. Graphical interfaces such as Heatmapper and expVIP render gene expression heatmaps but lack biological function views, while specialized resources like COMPARTMENTS and CellMap annotate individual protein localizations without dynamically mining comparative abundance across contrasting clinical conditions.
To establish a rigorous spatial framework, the system architecture maps molecular quantities across eleven canonical subcellular compartments derived from benchmark records. The researchers harvested protein localization evidence from four major public biological repositories, consisting of the COMPARTMENTS database, UniProt, the Human Protein Atlas, and LocTree3. Because COMPARTMENTS scores spatial annotations across knowledge channels, experimental assays, text mining, and predictive algorithms, the authors extracted its high-confidence benchmark set as a baseline standard. By harmonizing entries across all four repositories into the eleven benchmark location labels, the platform compiled a comprehensive atlas containing 34,172 curated protein-location pairs. Because individual proteins often carry out biological duties in more than one organelle simultaneously, the pipeline allows single proteins to carry multiple spatial labels. Due to the lack of exhaustive condition-specific spatial atlases across every cancer type, the system maps observed abundance values across all recognized locations where each protein is known to reside.
The system ingests cancer profiling datasets spanning seven distinct primary malignancies obtained through the Clinical Proteomic Tumor Analysis Consortium Python data application programming interface. The evaluated clinical cohorts encompass breast cancer, clear cell renal cell carcinoma, colon cancer, lung adenocarcinoma, glioblastoma multiforme, endometrial cancer, and ovarian cancer cohorts. For breast cancer, the collected transcriptomic and proteomic profiles extend further into five discrete PAM50 molecular subtypes, namely Her2, Luminal A, Luminal B, Basal, and Normal-like tumors. Because the mass spectrometry quantification values in the repository represent log-transformed ratios relative to a pooled reference standard, taking raw mathematical means directly from these log values would distort the true proportions of underlying biological quantities. To preserve mathematical proportional consistency, the algorithm first exponentiates each sample ratio value before calculating the arithmetic mean across all evaluated clinical samples within a specific tumor cohort, establishing an unskewed aggregate quantity for each protein.
Mathematical modeling within the platform converts these aggregated molecular quantities into standardized spatial enrichment distributions across the eleven subcellular compartments. For any given compartment, the software calculates an enrichment score by averaging the aggregated quantities of all resident proteins identified within that anatomical location. To transform these raw compartmental scores into a unified probability distribution across the entire cellular architecture, the complete vector of eleven location scores is processed through a normalized softmax function. This normalization produces a relative distribution showing how cellular quantities are partitioned across organelles for any selected cancer cohort or molecular layer. Furthermore, the platform integrates functional pathway annotations from the Kyoto Encyclopedia of Genes and Genomes, enabling users to restrict mathematical enrichment calculations to defined protein subsets participating in targeted biological processes, thereby linking organelle-level abundance shifts directly to specific metabolic or signaling pathways.
To assist researchers in navigating vast combinations of clinical diagnoses and functional cascades, the platform quantifies divergence between tumor profiles using two standard statistical discrepancy metrics. Users can evaluate comparative distributions across paired tumor groups by ranking biological pathways through either Mean Squared Error or Kullback-Leibler Divergence calculations. In practice, researchers often do not know in advance which biological pathways exhibit significant perturbations between contrasting clinical states. By computing discrepancy metrics across all annotated functional pathways, the system programmatically sorts pathways according to their degree of spatial redistribution. The software interface displays these comparative scores alongside interactive cell diagrams and color-coded location heatmaps, where color intensity reflects calculated compartmental enrichment. When an investigator selects a divergent compartment on the interactive visual map, the interface instantly reveals the underlying constituent proteins, allowing users to rapidly pinpoint specific molecular drivers behind organelle-level variations.
The utility of integrating subcellular location filtering was validated through disease gene detection benchmarks using known disease-associated genes from the DisGeNET database as an objective ground truth. The investigators conducted differential gene and protein expression analyses using Welch’s t-test with Bonferroni multiple testing corrections, classifying molecules with adjusted p-values below 0.05 as significantly altered. In conventional differential testing lacking spatial information, true disease genes often remain dispersed across thousands of statistically significant candidates, diluted by non-specific false positives. When the researchers filtered candidate proteins using the most discriminative subcellular locations identified by the system, ground-truth disease genes experienced substantial ranking boosts. For example, in the lung adenocarcinoma proteome, applying a spatial filter restricted to the top differing location identified six confirmed DisGeNET ground-truth genes within the top 297 positions, with the MET oncogene ranked at position 297. Without location filtering, evaluating six ground-truth genes required reviewing 1,394 candidates, while MET was buried at rank 4,395.
Broader quantitative benchmarking confirmed that spatial filtering systematically enriches true disease markers across diverse tumor types. When the authors matched the total candidate pool sizes of spatially filtered results with standard p-value-filtered lists lacking spatial constraints, more than four out of six tested cancer types captured a larger number of ground-truth genes under location-based filtering. This rank-boosting effect proved particularly pronounced across proteomic datasets, where organelle filtering systematically purged intervening false-positive proteins from the candidate lists. While this enrichment effect was less pronounced in transcriptomic datasets, where overall numbers of captured ground-truth genes showed minor variations between conditions, positive rank improvements were still documented in more than half of the tested transcriptomic cohorts, demonstrating that spatial compartmentalization provides robust mathematical prioritization across divergent molecular data types.
In practical application case studies, the platform demonstrated its capacity to rediscover validated oncogenic biomarkers across breast cancer subtypes through automated pathway sorting. Analyzing basal-like breast cancer, a subtype recognized for aggressive clinical progression and poor prognosis, against luminal subtypes highlighted marked proteomic disparities. When filtering for cancer-related pathways exhibiting high Kullback-Leibler Divergence, the basal cell carcinoma pathway revealed a dramatic enrichment gap within the endoplasmic reticulum between basal and Luminal B cohorts. Inspection of the underlying constituent proteins revealed that this endoplasmic reticulum discrepancy stemmed directly from the marked overexpression of TP53 in the basal subtype. Because TP53 encodes the p53 tumor suppressor, which is typically produced in the nucleus and mobilized to the cytoplasm under DNA damage, its persistent overexpression reflects stabilizing mutations that correlate with aggressive disease and poor clinical survival.
Further exploration of breast cancer subtypes using the platform revealed additional organelle-specific protein perturbations tied to cell survival and death pathways. Evaluating the ferroptosis pathway revealed significant proteomic overexpression of both SLC11A2 and the transferrin receptor protein TFRC within lysosomes among basal tumors compared to luminal counterparts, while transcriptomic profiles demonstrated corresponding TFRC overexpression in the extracellular space. Examining apoptosis pathways between basal-like and HER2-positive cohorts similarly identified pronounced mitochondrial divergence driven by DIABLO/Smac, a mitochondrial protein that normally promotes cytochrome c-dependent caspase activation. In basal-like tumors, DIABLO/Smac displayed notably depressed expression, corroborating the highly proliferative and anti-apoptotic behavior typical of basal malignancies. Concurrently, examining the p53 signaling cascade captured diminished expression of the PTEN tumor suppressor in basal-like breast cancer relative to HER2-positive tumors, aligning with established markers of reduced clinical survival.
A second case study focused on discriminating between gynaecological malignancies, comparing endometrial cancer against ovarian cancer without supplying prior biological hypotheses. Sorting transcriptomic profiles by Kullback-Leibler Divergence immediately identified Fc gamma R-mediated phagocytosis as the most divergent pathway between the two cancers, with the primary distribution gap occurring in the extracellular space. The software pinpointed gelsolin, encoded by the GSN gene, as the dominant driver of this extracellular variation. GSN regulates actin filament assembly to promote cellular motility and tumor invasion, exhibiting documented overexpression and poor prognosis in ovarian cancer while acting as a downregulated tumor suppressor in breast cancer. The platform recorded normalized GSN transcript expression at 56.02 in ovarian cancer and 12.35 in endometrial cancer, compared to -0.05 in breast cancer, confirming that extracellular gelsolin divergence differentiates these gynaecological malignancies.
The gynaecological analysis also illuminated notable multi-omics discordances that highlight the necessity of parallel transcriptomic and proteomic evaluation. Although GSN transcript levels peaked in ovarian cancer, proteomic analysis revealed that GSN protein abundance was actually highest in breast cancer specimens, completely reversing extracellular compartment enrichment between breast and ovarian cohorts. In a parallel investigation of the cardiac muscle contraction pathway, the system detected distinct mitochondrial enrichment in ovarian cancer transcriptomes driven by elevated TNNC1, a troponin subunit isoform that regulates striated muscle contraction. Transcriptomic expression of TNNC1 reached 10.4166 in ovarian cancer compared to 7.2552 in endometrial cancer, while corresponding proteomic measurements detected TNNC1 exclusively within ovarian specimens. These observed omics discrepancies underscore how post-transcriptional mechanisms decouple mRNA and protein abundance, reinforcing the analytical value of compartmentalized multi-omics platforms for cancer biology.
Subject of Research: Subcellular location-specific multi-omics data mining in cancer research
Article Title: ALPACA: a visual data mining system for subcellular location-specific knowledge mining from multi-omics data in cancer
Article References: Pak, M., Jeong, D., Park, S., Gu, J., Lee, S., & Kim, S. (2026). ALPACA: a visual data mining system for subcellular location-specific knowledge mining from multi-omics data in cancer. BMC Medical Genomics, 16(S1), Article 336. https://doi.org/10.1186/s12920-026-02440-4
Image Credits: AI Generated
DOI: 10.1186/s12920-026-02440-4
Keywords: cancer genomics, computational biology, proteomics, transcriptomics, subcellular localization, data mining, biomarkers, bioinformatics, ALPACA, visual, data, mining
Cite Scienmag News
Nathaniel Bowman. (November 6, 2026). Visual Data Mining Platform Maps Cancer Multi-Omics Across Subcellular Compartments. Scienmag. https://scienmag.com/visual-data-mining-platform-maps-cancer-multi-omics-across-subcellular-compartments/
Nathaniel Bowman. "Visual Data Mining Platform Maps Cancer Multi-Omics Across Subcellular Compartments." Scienmag, 6 November 2026, https://scienmag.com/visual-data-mining-platform-maps-cancer-multi-omics-across-subcellular-compartments/. Accessed 6 November 2026.
Nathaniel Bowman. "Visual Data Mining Platform Maps Cancer Multi-Omics Across Subcellular Compartments." Scienmag. November 6, 2026. https://scienmag.com/visual-data-mining-platform-maps-cancer-multi-omics-across-subcellular-compartments/