


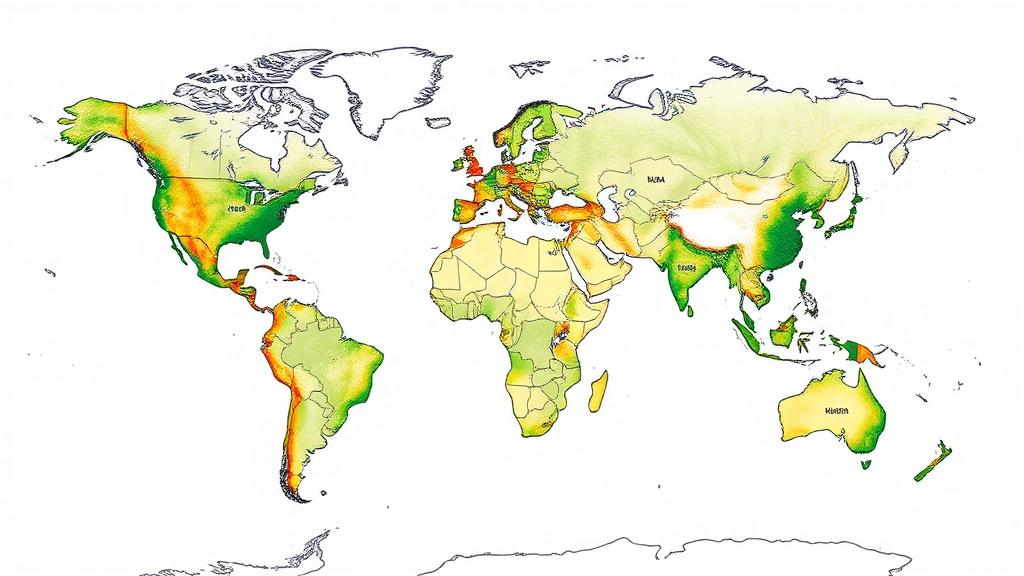
Nitrogen is the engine of modern agriculture, and for the first time scientists have built a single, harmonized global record of exactly where, when, and on which crops that engine has been fed. A research team led by Wensu Hao and Hanqin Tian of Boston College has unveiled HaNi-Crop, a gridded dataset that tracks nitrogen inputs from synthetic fertilizers and animal manure for 21 major crop groups across every agricultural region on Earth, year by year, from 1961 through 2023. The work, published as a preprint under review in the journal Earth System Science Data, arrives at a moment when the world is struggling to feed a growing population without drowning its rivers, coastlines, and atmosphere in reactive nitrogen.
The scale of the transformation the dataset documents is striking. In the early 1960s, at the dawn of the Green Revolution, synthetic fertilizer delivered roughly 11 teragrams of nitrogen to the world’s croplands each year. By 2023, that figure had climbed past 100 teragrams per year, nearly a tenfold increase in six decades. Manure nitrogen, the older and more diffuse pathway of nutrient delivery, rose more modestly but still substantially, from about 14 to 23 teragrams per year over the same period. Together, these two streams now represent one of the largest deliberate alterations of the global nitrogen cycle in Earth history, and their consequences ripple through greenhouse gas inventories, water quality assessments, and climate models alike.
What makes HaNi-Crop different from earlier attempts to map fertilizer use is its combination of four dimensions of detail that previous datasets handled only separately. It is crop-specific, distinguishing nitrogen applied to wheat from nitrogen applied to maize, rice, soybeans, and eighteen other crop groups. It is spatially explicit, resolved at a grid cell size of 0.1 degrees by 0.1 degrees, fine enough to capture variation between neighboring agricultural counties. It is temporally deep, spanning more than sixty years of annual estimates. And it is chemically differentiated, separating ammonium-based nitrogen inputs from nitrate-based ones, a distinction that matters enormously because the two forms behave differently in soil, emit different amounts of nitrous oxide, and leach into waterways at different rates.
The technical architecture behind the dataset builds on the History of Anthropogenic Nitrogen Inputs, or HaNi, data infrastructure established by Tian and colleagues in 2022. To construct the crop-level product, the team fused national and sub-national statistics on fertilizer consumption and manure production with high-resolution crop harvested-area maps, information on the specific fertilizer products used in different countries and eras, and a set of spatial allocation procedures that distribute reported totals across the landscapes where each crop actually grows. The result is an annual, gridded estimate of nitrogen application rates for every crop group, differentiated by chemical form, that can be dropped directly into ecosystem and Earth system models.
Among the dataset’s headline findings is the enduring dominance of the three great cereal crops. Wheat, maize, and rice together consistently absorbed approximately half of all synthetic fertilizer nitrogen applied globally throughout the entire 1961 to 2023 record. This concentration reflects both the sheer acreage these staples occupy and the intensive management they receive, particularly in the irrigated rice paddies of Asia and the maize belts of North America and China. It also means that any serious attempt to reduce the environmental footprint of nitrogen must grapple with cereal production systems, which feed the majority of humanity but operate at some of the lowest nitrogen use efficiencies in global agriculture.
The chemical split documented in the dataset tells its own story. Ammonium-based nitrogen, the form delivered by urea, ammonium sulfate, and anhydrous ammonia, surged from 8 teragrams per year in the early 1960s to nearly 90 teragrams per year by 2023. Nitrate-based fertilizers, by contrast, grew from only about 3 to roughly 12 teragrams per year. The divergence reflects decades of industrial chemistry favoring ammonium and urea products, which are cheaper to produce and transport. But it carries environmental weight: ammonium inputs undergo nitrification in soils, a microbial process that releases nitrous oxide, a greenhouse gas nearly 300 times more potent than carbon dioxide, and produces nitrate that is prone to leaching into groundwater and coastal waters.
Why does crop-specific resolution matter so much? Crops differ profoundly in how much nitrogen they demand, how efficiently they take it up, and what happens to the surplus. Rice paddies, flooded for much of the growing season, lose nitrogen through different pathways than rain-fed wheat fields. Perennial forage crops recycle nutrients differently than annual vegetables. When models lump all cropland together with a single average fertilizer rate, they systematically misestimate nitrous oxide emissions, nitrate leaching, and soil carbon dynamics. HaNi-Crop gives modelers, for the first time at global scale and across six decades, the crop-by-crop, form-by-form inputs needed to close those gaps, sharpening everything from national greenhouse gas inventories reported under the Paris Agreement to regional assessments of coastal hypoxia.
The dataset’s applications extend well beyond emissions accounting. Nitrogen budget analyses, which compare inputs against crop removal to calculate the surplus that escapes into the environment, depend critically on knowing which crops received which nutrients where. Agrifood-system resilience studies, increasingly urgent in an era of fertilizer price shocks and export restrictions, can use the record to identify regions dangerously dependent on synthetic inputs and to evaluate where manure recycling could substitute for manufactured fertilizer. Climate mitigation strategies, from nitrification inhibitors to precision application technologies, can now be evaluated against a realistic baseline of what was actually applied, to which crop, and in what chemical form, rather than against coarse national averages.
The timing of the release is notable. Global nitrogen flows have crossed several proposed planetary boundaries, and the United Nations and national governments have repeatedly called for improved nutrient management. Yet until now, the scientific community has lacked a single reference dataset that simultaneously covered crop specificity, fine spatial resolution, long temporal depth, and fertilizer form differentiation. Studies that needed such detail had to stitch together multiple products with incompatible assumptions, introducing uncertainties that propagated through policy-relevant conclusions. By harmonizing these dimensions in one openly available resource, published under a Creative Commons license and hosted on Zenodo, the HaNi-Crop team has removed a persistent bottleneck in sustainability science.
As with any dataset built from statistics and spatial allocation, HaNi-Crop carries uncertainties inherited from its inputs, and the preprint remains under peer review, with the discussion open to the community. But the six-decade record it assembles already offers an unflinching portrait of humanity’s nitrogen habit: a tenfold expansion of synthetic inputs concentrated on three cereal crops, increasingly dominated by ammonium chemistry, and spread across a map that now reveals, cell by cell, where the surplus nitrogen that fuels dead zones, smog, and warming will come from. Turning that portrait into policy, the authors suggest, is the next step, and for the first time the world has the data resolution to attempt it.
Subject of Research: A global gridded dataset of crop-specific nitrogen inputs from synthetic fertilizer and manure, 1961–2023
Article Title: HaNi-Crop: A Harmonized and Gridded Global Dataset of Crop-Specific Nitrogen Inputs from Nitrogen Fertilizer and Manure
Article References: Hao, W., Tian, H., Shi, H., Yu, X., Pan, N., Pan, S., Tubiello, F. N., Adalibieke, W., Bernoux, M., Ciais, P., Maggi, F., Nishina, K., Uwizeye, A., & Zhou, F. (2026). HaNi-Crop: A Harmonized and Gridded Global Dataset of Crop-Specific Nitrogen Inputs from Nitrogen Fertilizer and Manure. https://doi.org/10.5194/essd-2026-595
Image Credits: AI Generated
Keywords: nitrogen, fertilizer, manure, crops, HaNi-Crop, dataset, greenhouse gas emissions, nitrogen use efficiency, Earth system modeling, food security, agriculture, climate mitigation
Cite Scienmag News
Alan Morgan. (October 13, 2026). New Global Map Tracks Six Decades of Crop-Specific Nitrogen Pollution. Scienmag. https://scienmag.com/new-global-map-tracks-six-decades-of-crop-specific-nitrogen-pollution/
Alan Morgan. "New Global Map Tracks Six Decades of Crop-Specific Nitrogen Pollution." Scienmag, 13 October 2026, https://scienmag.com/new-global-map-tracks-six-decades-of-crop-specific-nitrogen-pollution/. Accessed 13 October 2026.
Alan Morgan. "New Global Map Tracks Six Decades of Crop-Specific Nitrogen Pollution." Scienmag. October 13, 2026. https://scienmag.com/new-global-map-tracks-six-decades-of-crop-specific-nitrogen-pollution/


