In the vast agricultural frontier of western Bahia, Brazil, the difference between a thriving soybean harvest and a failed season often comes down to something no one can see: water locked deep beneath the red earth. Now, a new study published in Hydrogeology Journal has produced the first basin-scale map of groundwater potential for the Grande River Hydrographic Basin, a 75,000-square-kilometer region where seasonal drought has pushed farmers, towns, and industry increasingly toward the aquifers below. The research, led by Thyago Anthony Soares Lima and Paulo de Tarso Amorim Castro of the State University of Feira de Santana, combines satellite data, digital terrain models, and a structured decision-analysis technique to reveal where the ground is most likely to soak up rainfall and store it underground—and, crucially, where intense pumping may already be pushing those hidden reserves toward stress.
The study arrives at a moment when groundwater has become the strategic lifeline of Brazil’s semi-arid Northeast. Surface rivers in the region swing dramatically between flood and trickle, and the Grande River itself, which runs 502 kilometers before joining the São Francisco, depends heavily on what hydrogeologists call baseflow—the slow seepage of groundwater into stream channels that keeps rivers alive through the dry austral winter. Rainfall across the basin follows a steep west-to-east gradient, from as much as 2,000 millimeters per year in the humid western headwaters to under 800 millimeters in the eastern semi-arid zone, a reduction of roughly 55 percent. That gradient, the researchers found, is the single most important control on where groundwater systems can recharge, but it interacts with geology, soils, slope, and land use in ways that only a spatially explicit map can untangle.
To build that map, the team assembled ten thematic layers, each serving as a proxy for conditions that favor recharge and subsurface storage. These included lithology, land use and land cover, drainage density, lineament density derived from satellite imagery, precipitation, soil type, elevation, slope, hydrogeological units, and vegetation. Data came from existing national datasets and remote sensing products, including 30-meter Shuttle Radar Topography Mission elevation data, Landsat 8 imagery processed with directional filtering and an automated lineament-detection algorithm, and roughly one-kilometer-resolution WorldClim rainfall surfaces spanning 1970 to 2020. Every layer was resampled onto a uniform 30-by-30-meter grid at a consistent mapping scale of 1:250,000, allowing the researchers to combine datasets that originally differed wildly in resolution and format.
The integration itself relied on the analytic hierarchy process, or AHP, a knowledge-based weighting scheme developed in the 1980s that remains a workhorse of groundwater mapping in data-poor regions. The method asks researchers to compare every pair of factors and assign relative importance on a scale from one to nine, producing a matrix whose internal consistency can be mathematically tested. In this study, precipitation and the basin’s lithology and hydrogeological units received the highest weights, reflecting the dominant influence of the rainfall gradient and the sedimentary aquifer systems on recharge conditions. The consistency ratio came out at 0.083, comfortably below the accepted threshold of 0.10, meaning the expert judgments embedded in the weighting were internally coherent rather than arbitrary. The weighted layers were then combined through a linear equation to yield a continuous groundwater potential index, which was classified into five zones ranging from very low to very high.
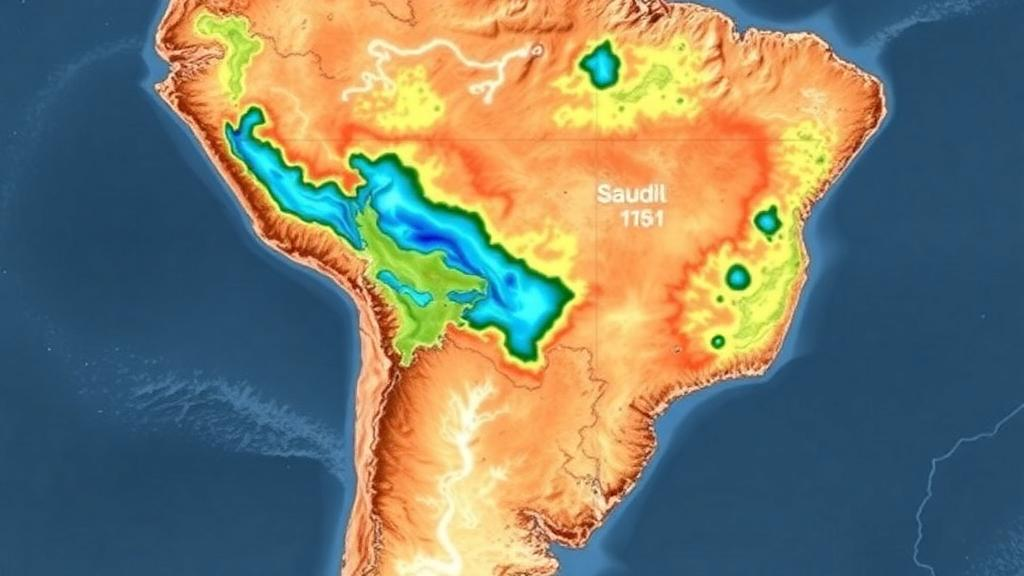
The results paint a basin split into two fundamentally different worlds. Very high and high potential zones together cover nearly three-quarters of the basin—48.08 percent and 25.41 percent respectively—concentrated in the western and southwestern sectors where rainfall is abundant, terrain is gentle, and the porous sandstones of the Urucuia Aquifer System dominate the landscape. This Mesozoic sedimentary unit, which blankets roughly 70 percent of the basin surface, stores water in connected pore spaces between sand grains and sustains regional baseflow to the São Francisco River, with transmissivity values on the order of 10⁻² to 10⁻³ square meters per second. Moderate potential accounts for another 19.90 percent, while the low and very low classes—just 6.59 percent of the basin—are squeezed into the drier northeastern corner, where metamorphic and crystalline bedrock, clay-rich soils, steeper slopes, and the lowest rainfall combine to shut down infiltration.
What makes the study more than a pretty map is the battery of independent checks the authors ran against it. They compiled a screened inventory of 3,148 wells from multiple sources and overlaid the locations on their classified map. The agreement was striking: 90.91 percent of wells fall within high or very high potential zones, rising to 97.40 percent when the moderate class is included, and roughly 86 percent of the wells sit atop the Urucuia sandstone. A receiver operating characteristic analysis, which quantifies how well the index discriminates between well locations and background conditions, produced an area under the curve of 0.821—a value the authors interpret as good discrimination and strong internal consistency for a proxy-based screening product.
But the well data also told a more complicated story. A global Moran’s I statistic of 0.884, highly significant at z = 23.58, revealed that wells are not scattered randomly across the basin but cluster intensely in the central-western and western sectors. The authors are careful about what this means: drilling locations reflect not only hydrogeological favorability but also accessibility, infrastructure, land tenure, and concentrated water demand. In other words, the wells confirm the map’s logic, but they also trace a human footprint superimposed on the geology—one that signals where people want water, not necessarily where water is most sustainable to extract.
That distinction matters because the study’s most consequential finding may be what happens when favorability and demand collide. Only 835 of the 3,148 wells—26.5 percent—reported non-zero daily abstraction volumes, but those records allowed the team to build an abstraction-pressure proxy using kernel density estimation weighted by the logarithm of pumping rates. When this pressure surface was compared with the favorability map, the overlap was dramatic: 91.4 percent of pumping wells sit in the high-favorability classes, and median reported abstraction rises from 3.2 cubic meters per day in moderate zones to 8.9 cubic meters per day in very high zones. The researchers designate these overlap areas as potential stress zones—places where the best physical conditions coincide with the heaviest pumping, and where groundwater levels, water quality, and long-term drawdown deserve the closest monitoring.
The authors are explicit that their map is a screening tool, not a verdict. Groundwater potential, as they define it, is a relative index of conditions favorable to recharge and storage—not a measure of aquifer productivity such as well yield or transmissivity, and certainly not a certificate of sustainable yield under continued extraction. The AHP approach carries an inherent subjectivity in factor selection and weighting, the input layers differ in resolution and temporal coverage, and spatially continuous data on groundwater levels, aquifer thickness, and recharge rates simply do not exist for the basin. Pumping records are incomplete and likely non-randomly missing. Yet within those limits, the map gives water managers something they have never had for this basin: a transparent, testable, basin-scale framework for deciding where to drill monitoring wells, where to send field campaigns, and where licensing and demand management should focus first.
The stakes are only likely to rise. The authors sketch two plausible futures for the Grande River Basin: continued expansion of irrigated agriculture and agro-industry across the already high-favorability western sectors, pushing moderate and high zones toward stress without changing their intrinsic geology; and intensifying climate variability, with longer dry spells and more concentrated rainfall, driving deeper reliance on aquifers precisely when recharge is weakest. In either scenario, the zones flagged by the study—where high favorability overlaps with concentrated abstraction—would be the first to feel the squeeze. For a region whose economic engine runs on water most of its residents will never see, knowing where that water lives, and where it is being drawn down fastest, may prove to be the most valuable data point of all.
Subject of Research: GIS-based groundwater potential zoning in the semi-arid Grande River Basin, western Bahia, Brazil
Article Title: Groundwater potential zoning in the Grande River Basin: A semi-arid region of Northeast Brazil
Article References: Groundwater potential zoning in the Grande River Basin: A semi-arid region of Northeast Brazil. (n.d.). https://doi.org/10.1007/s10040-026-03188-y
Image Credits: AI Generated
DOI: 10.1007/s10040-026-03188-y
Keywords: groundwater, hydrogeology, Brazil, semi-arid, GIS, analytic hierarchy process, remote sensing, aquifer recharge, Urucuia Aquifer System, water scarcity, groundwater management, ROC analysis
Cite Scienmag News
Violet Maxwell. (October 13, 2026). Satellite-Driven Maps Reveal Where Hidden Water Lies Beneath Brazil’s Drought-Stricken Northeast. Scienmag. https://scienmag.com/satellite-driven-maps-reveal-where-hidden-water-lies-beneath-brazils-drought-stricken-northeast/
Violet Maxwell. "Satellite-Driven Maps Reveal Where Hidden Water Lies Beneath Brazil’s Drought-Stricken Northeast." Scienmag, 13 October 2026, https://scienmag.com/satellite-driven-maps-reveal-where-hidden-water-lies-beneath-brazils-drought-stricken-northeast/. Accessed 13 October 2026.
Violet Maxwell. "Satellite-Driven Maps Reveal Where Hidden Water Lies Beneath Brazil’s Drought-Stricken Northeast." Scienmag. October 13, 2026. https://scienmag.com/satellite-driven-maps-reveal-where-hidden-water-lies-beneath-brazils-drought-stricken-northeast/