


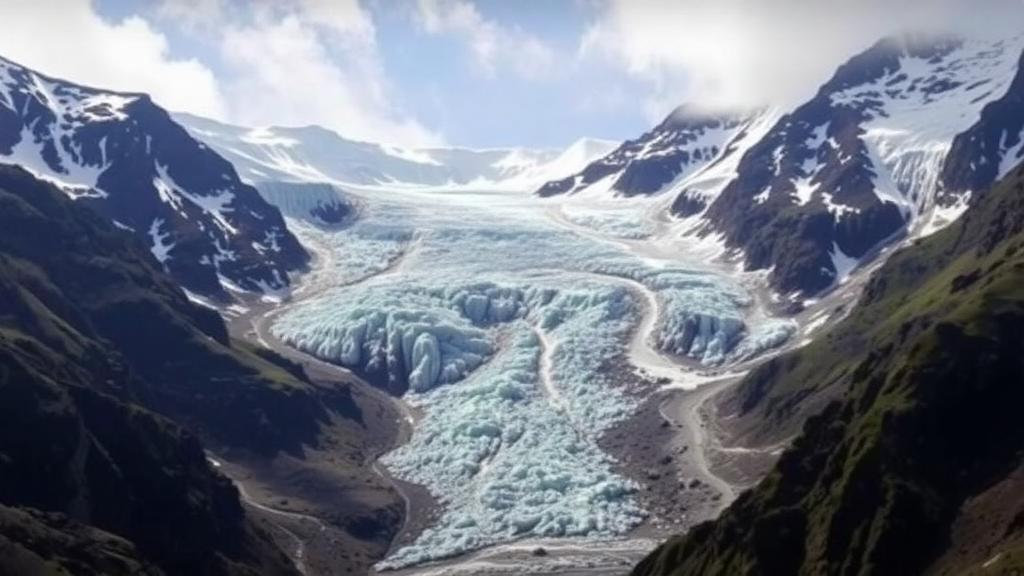
High in the western Himalaya, the glaciers feeding the Baspa River are quietly running a deficit that scientists can now measure with unprecedented precision. A new study published in Theoretical and Applied Climatology reports that glaciers in the Baspa Basin of Himachal Pradesh, India, have lost a cumulative 1.2 ± 0.4 gigatonnes of ice between 1995 and 2022, with no year of net recovery after 1996. The research, conducted by A. R. Arya and Harini Santhanam of Manipal Academy of Higher Education, goes beyond simply documenting the loss: it introduces a new framework, the Unit of Glacier Sustainability, designed to identify which groups of glaciers within a basin are holding on and which are slipping toward collapse.
The stakes extend far beyond the basin itself. The Baspa River is a left-bank tributary of the Satluj, one of the major rivers of the Indus system, and its 1,102 square kilometre catchment is roughly one-fifth covered by glaciers. Downstream, that water sustains apple orchards in Kinnaur district, one of India’s most celebrated horticultural regions, and drives the 300-megawatt Baspa II hydropower station. Himachal Pradesh is among India’s largest producers of hydroelectricity, and the meltwater from these glaciers and seasonal snows is the raw material of that economy. The study’s authors frame their work explicitly around the abiotic ecosystem services that glaciers provide: freshwater provisioning, climate regulation, and energy production, all of which are threatened as the ice reserve shrinks.
Measuring glacier mass balance across dozens of remote, debris-strewn Himalayan glaciers by field survey alone is practically impossible, so the team turned to a hybrid approach. They refined glacier outlines from the Randolph Glacier Inventory version 7.0 using cloud- and snow-free Landsat imagery, delineating transient snowlines during the summer ablation season from 1990 to 2021. Snout positions were identified through a combination of visual interpretation, drainage patterns, and digital elevation model analysis. From these satellite-derived snowlines, the researchers applied an Improved Accumulation Area Ratio method, a technique that couples observed snowline elevations with a temperature-index melt model to reconstruct annual mass balance for each glacier, a method previously validated against field measurements in other Himalayan basins.
Climatic inputs came from two sources stitched together with careful statistical treatment. Daily temperature and snowfall records from the Rakchham meteorological observatory covered 1984 to 2013, but the observatory record ended there. To extend the analysis through 2022, the team used ERA5 reanalysis data from the Copernicus Climate Change Service, bias-corrected against the station observations using the change factor method. Additive corrections were applied to maximum and minimum temperatures, while multiplicative adjustments were made to snowfall, preserving the variable-specific character of each record. Validation with root mean square error, mean absolute error, and correlation statistics showed the corrected datasets reproduced the observed climate variability well, though precipitation remained the noisier variable, as is typical in high-relief terrain with strong elevation gradients.
The trend analysis painted a coherent picture of a warming, less snowy basin. Summer maximum and minimum temperatures both showed statistically significant increases during the June-to-September ablation season, with Mann-Kendall Z values of 2.40 and 1.96 respectively. Winter minimum temperatures also rose significantly, and accumulation-season snowfall declined significantly at a rate of 5.6 millimetres per year, accompanied by a marked drop in the number of snowfall days after 2010. Correlation analysis reinforced the link to glacier health: snowfall correlated strongly and positively with mass balance, while maximum temperature showed a moderately strong negative correlation. In other words, the basin’s glaciers are being squeezed from both ends, receiving less winter nourishment while losing more summer mass.
The resulting mass balance record is sobering. The mean basin-wide balance was −0.60 ± 0.04 metres of water equivalent per year during the station-data era and −0.51 ± 0.06 metres per year when extended through 2022 with corrected reanalysis data. Only a handful of years, 1987, 1988, 1991, 1992, 1994, 1997, and 2006, posted positive balances, each coinciding with positive winter snowfall anomalies and cooler summers. After 1996 the losses became continuous. The total water loss attributable to melting between 1985 and 2022 was estimated at 19 percent, and the cumulative ice loss of 1.2 ± 0.4 gigatonnes carries a propagated uncertainty of ±2.6 metres of water equivalent, derived from errors in temperature, precipitation, lapse rates, precipitation gradients, and density conversion.
Paradoxically, the study found that the combined meltwater and snowfall contribution to the basin has been increasing slightly, at about 0.005 metres per year, while snowfall alone has declined. The cumulative hydrological contribution rose almost perfectly linearly, with a coefficient of determination of 0.9978. The authors are careful to warn against misreading this as glacier health: the rising curve reflects the progressive accumulation of annual melt as the ice reserve is drawn down, a pattern consistent with the well-documented peak water phenomenon. Initially, shrinking glaciers deliver more water to rivers, but as the ice volume dwindles, that contribution will fall, altering the long-term hydrological regime of glacier-fed basins across the region.
The most innovative part of the work lies in how the researchers sorted the basin’s 33 significant glaciers into functional groups. They normalized each glacier’s mass balance against the basin mean to produce a Mass Balance Ratio, then applied principal component analysis to cluster glaciers with similar behaviour, refining the clusters with aspect and slope information. Validation metrics, a Silhouette Score of 0.461 and a Davies-Bouldin Index of 0.725, indicated meaningful, well-separated groupings. Spatial statistics added another layer: Global Moran’s I of 0.124 suggested weak but present spatial clustering, while Local Indicators of Spatial Association mapped high-high clusters of relatively stable, high-altitude, north-facing glaciers and low-low hotspots of accelerated loss at lower, sun-exposed elevations. Six glaciers, including numbers 3 through 7 and 33, defied any cluster, apparently governed by localized factors such as debris cover or microclimate.
The heterogeneity is the message. Glaciers separated by only a few kilometres responded differently to the same regional climate, depending on elevation, hypsometry, aspect, and shading, with southwest- and west-facing ice melting fastest. This is precisely why the Unit of Glacier Sustainability framework matters: rather than treating a basin’s glaciers as a monolith, it identifies coherent groups with shared vulnerability, giving water managers and adaptation planners a finer-grained map of where meltwater services are most at risk. The authors acknowledge the framework’s limitations, including the absence of independent validation datasets and the fact that energy-balance variables like radiation and humidity were not modelled, and they caution that the sustainability classes are relative, basin-specific interpretations rather than universal indices.
Even so, the Baspa results align with independent evidence. The team’s estimates sit within the uncertainty range of a geodetic assessment for the basin and reasonably match field measurements at Naradu Glacier, and they echo regional findings of accelerated ice loss across High Mountain Asia, where ice loss rates roughly doubled after 2000. With more than a billion people in Asia potentially facing reduced freshwater availability by mid-century, and with glacial lake outburst floods an escalating hazard in deglaciating valleys, tools that translate satellite snowlines into basin-scale sustainability diagnostics arrive at an opportune moment. For the villages, orchards, and turbines of the Baspa valley, the study’s central finding is unambiguous: the ice that sustains them has been in continuous decline for nearly three decades, and the window for planning around that reality is defined by how much glacier remains.
Subject of Research: Glacier mass balance and sustainability assessment in the Baspa Basin, western Himalaya, India
Article Title: Measuring glacial sustainability using glacial mass balance at Baspa Basin, India
Article References: Arya, A. R., & Santhanam, H. (2026). Measuring glacial sustainability using glacial mass balance at Baspa Basin, India. Theoretical and Applied Climatology, 157(10), Article 679. https://doi.org/10.1007/s00704-026-06548-6
Image Credits: AI Generated
DOI: 10.1007/s00704-026-06548-6
Keywords: glacier mass balance, Baspa Basin, Himalaya, climate change, remote sensing, equilibrium line altitude, ERA5 reanalysis, ecosystem services, hydropower, water resources, spatial analysis, glacier sustainability
Cite Scienmag News
Sloane Callahan. (September 30, 2026). Himalayan Glaciers in India’s Baspa Basin Have Lost 1.2 Billion Tonnes of Ice Since 1995. Scienmag. https://scienmag.com/himalayan-glaciers-in-indias-baspa-basin-have-lost-1-2-billion-tonnes-of-ice-since-1995/
Sloane Callahan. "Himalayan Glaciers in India’s Baspa Basin Have Lost 1.2 Billion Tonnes of Ice Since 1995." Scienmag, 30 September 2026, https://scienmag.com/himalayan-glaciers-in-indias-baspa-basin-have-lost-1-2-billion-tonnes-of-ice-since-1995/. Accessed 30 September 2026.
Sloane Callahan. "Himalayan Glaciers in India’s Baspa Basin Have Lost 1.2 Billion Tonnes of Ice Since 1995." Scienmag. September 30, 2026. https://scienmag.com/himalayan-glaciers-in-indias-baspa-basin-have-lost-1-2-billion-tonnes-of-ice-since-1995/


