


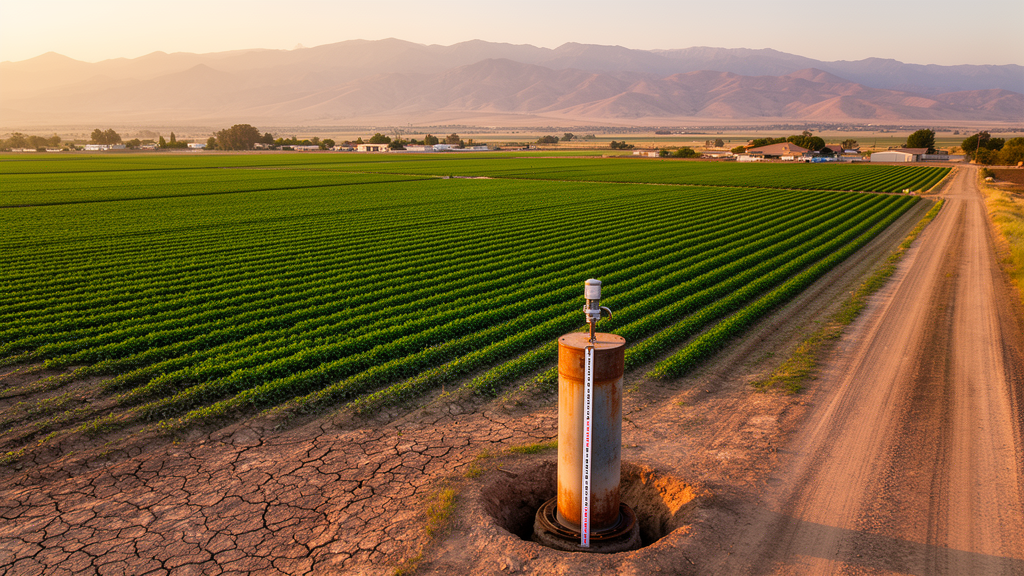
For more than two decades, the GRACE satellite missions have given scientists a planetary-scale view of groundwater change, but that view has always been blurred. The satellites detect Earth’s shifting gravity field from hundreds of kilometres above, which means their effective spatial resolution is limited to several hundred kilometres on the ground. Fine-scale aquifer dynamics, such as steep depletion gradients along irrigation boundaries in the North China Plain or the High Plains of the United States, simply vanish into the coarse anomaly fields. Now a team of researchers in China has produced a global monthly groundwater storage anomaly dataset at 1 km resolution covering April 2002 through December 2020, published in Earth System Science Data, and it promises to change how scientists and water managers see the hidden water beneath our feet.
The dataset, created by Chen Zhang, Yifei Fan, Wenxia Han, Yingchun Ge, Jiabei Zhu and Tao Che from institutes of the Chinese Academy of Sciences, was built by combining satellite observations, high-resolution environmental data and machine learning. The starting point is the GRACE and GRACE-FO mascon solutions from the University of Texas Center for Space Research, which provide monthly terrestrial water storage anomalies at 0.25 degrees. Because the GRACE missions suffered 35 months of missing observations, including an 11-month gap between the two missions after July 2017, the team first used Singular Spectrum Analysis to fill the temporal gaps. This technique decomposes the trajectory matrix of each pixel’s time series, extracts dominant modes and reconstructs the missing values through diagonal averaging, with cross-validation experiments masking entire years to quantify reconstruction errors. The median error was 1.156 cm for short gaps and 1.679 cm globally for the longer gap-filling phase, rising to 2.708 cm over land.
Once the terrestrial water storage record was temporally continuous, the researchers isolated the groundwater component through a vertical water balance. Monthly soil water storage from the four Noah soil layers of NASA’s GLDAS Noah V2.1 product, together with snow water equivalent and vegetation canopy water storage, were subtracted from the GRACE signal. All components were converted to centimetres of equivalent water height and expressed as anomalies relative to a 2004-2009 baseline to match the GRACE definition. Permanent water bodies were masked using the Global Surface Water Explorer, and glaciers and ice sheets were masked with the Randolph Glacier Inventory and the Greenland Ice Mapping Project, reducing contamination from signals that do not belong to groundwater at all.
The heart of the work is the downscaling framework. The team assembled a database of 19 environmental predictors at 1 km resolution, including monthly temperature and precipitation from CHELSA, evapotranspiration from PML_V2, daily surface soil moisture from a jointly inverted ERA5 and ESA-CCI product, elevation from GMTED2010, eight soil attributes from SoilGrids, and vegetation index and land surface temperature from MODIS. Two additional temporal coding variables derived from sine and cosine transformations capture seasonal characteristics. Separate machine learning models were trained for each aquifer category defined by the WHYMAP global aquifer map, recognising that hydrogeological conditions differ profoundly between major groundwater basins, complex structures and local shallow aquifers. Two candidate architectures were evaluated: XGBoost, a gradient-boosted tree ensemble, and a deep neural network built as a multilayer perceptron with three to six layers of 128 to 768 units, trained with the Adam optimizer and early stopping.
XGBoost won the production role on the strength of consistent performance across aquifer categories. When the 1 km reconstructions were aggregated back to the original 0.25 degree GRACE scale, the product agreed closely with the original groundwater storage anomalies, achieving a coefficient of determination of 0.972 and a root mean square error of 2.10 cm, compared with 0.961 and 2.661 cm for the neural network. The tree ensemble also outperformed the deep network in 10 of 11 evaluated aquifer categories in internal tests. The researchers are careful to note that the random 70/30 training-test split used for model development does not constitute a spatially or temporally independent generalization test, which is why the independent validation against monitoring wells carries so much weight.
That validation is arguably the most ambitious part of the study. The team drew on a global archive of 152,069 groundwater monitoring wells compiled by Jasechko and colleagues, with annual records spanning 2002 to 2020, and partitioned the network into 1 degree spatial blocks, using roughly 70 percent of blocks for calibration and holding out 30 percent for blind validation. Because groundwater levels and storage have different physical dimensions, an effective specific yield coefficient was estimated only from calibration blocks and transferred to held-out blocks without refitting. On the common 0.25 degree grid, the XGBoost product achieved a coefficient of determination of 0.538, a root mean square error of 0.378 cm per year and a bias of 0.106 cm per year against the held-out observations, with trend-sign consistency of 0.73. Sensitivity experiments perturbing the conversion coefficient by up to 30 percent showed that correlation and trend-direction agreement were robust, while amplitude-related metrics such as the regression slope responded more strongly.
Conversion-free comparisons using independently standardized time series revealed where the product shines and where it struggles. In climate-driven basins such as the Stampriet-Kalahari Basin, with 7,849 wells, the correlation reached 0.82, accurately reproducing multi-year depletion and recovery. Strong agreement also appeared in the Cuvelai-Upper Zambezi Basin, the Russian Platform Basins and the Ganges-Brahmaputra Basin. In intensively managed aquifers, however, the picture diverges: in the Northern Great Plains Aquifer the correlation was negative, with the satellite-constrained reconstruction indicating climate-driven recovery while local wells showed sustained depletion, a decoupling the authors interpret as a signal potentially consistent with anthropogenic pumping rather than a direct estimate of extraction. Monthly validation across five representative aquifers showed that the reconstruction reproduces long-term variability better than seasonal fluctuations, with mean correlations of 0.55 for trends versus 0.39 for seasonal components.
Regional benchmarks against published estimates added further nuance. Agreement was strongest in the North China Plain, with a correlation of 0.963, while depletion magnitudes were weaker than published values in northwestern India and California. In the High Plains Aquifer, the reconstructed trend during the published 2003-2013 window had the opposite sign to the reference estimate, a mismatch the authors flag clearly rather than explain away. Experiments using alternative target products, including the JPL mascon solution and the H08 and WaterGAP global hydrological models, showed that reconstruction performance and predictor importance depend on the input source, with static physiography and soil variables dominating for satellite targets while temporal encoding gained weight for model targets.
The global climatology that emerges from the dataset is striking. Significant depletion hotspots concentrate in the Indus-Ganges Basin, the North China Plain, the Arabian Peninsula, the Caspian Sea region and the High Plains of the United States, while surplus zones align with tropical rainforest areas under the Intertropical Convergence Zone and mid-to-high-latitude regions. A meridional mean profile reveals a pronounced depletion trough between 25 and 45 degrees north, the belt combining the descending branch of the Hadley Cell with the world’s densest irrigation. Seasonally, more than half of the global land area, 52.30 percent, is governed by recurrent intra-annual cycles, while arid interiors such as North Africa, the Arabian Peninsula and Central Asia are dominated by persistent non-seasonal deficits. Statistically, about 38.84 percent of effective land area shows significant depletion and 49.16 percent significant recharge, with only 12 percent in stable equilibrium.
The authors are explicit about the limits of their creation. The kilometre-scale patterns are predictor-informed reconstructions under coarse-scale GRACE constraints, not independent satellite observations, and residual surface-water variability may remain in the estimates, especially in tropical and floodplain-dominated regions. Local attribution of the fine-scale textures, such as gradients aligned with agricultural boundaries around New Delhi or the Zhangye oasis in the hyper-arid Heihe River Basin, requires additional observations of groundwater levels, abstraction, recharge and aquifer properties. Within those constraints, the openly available dataset, hosted by the National Cryosphere Desert Data Center and previewable through Google Earth Engine, offers scientists a powerful new lens for regional groundwater assessment, hydrological model evaluation and studies of how the world’s largest accessible freshwater resource responds to climatic and human pressures.
Subject of Research: High-resolution global groundwater storage anomalies: a 1 km downscaled dataset
Article Title: High-resolution global groundwater storage anomalies: a 1 km downscaled dataset
Article References: Zhang, C., Fan, Y., Han, W., Ge, Y., Zhu, J., & Che, T. (2026). High-resolution global groundwater storage anomalies: a 1 km downscaled dataset. Earth System Science Data, 18(10), 7593-7626. https://doi.org/10.5194/essd-18-7593-2026
Image Credits: AI Generated
DOI: 10.5194/essd-18-7593-2026
Keywords: groundwater, GRACE, machine learning, XGBoost, water security, aquifer depletion, remote sensing, downscaling, hydrology, Earth observation, data science, sustainability
Cite Scienmag News
Violet Maxwell. (October 19, 2026). New 1 km global groundwater dataset brings hidden aquifer changes into view. Scienmag. https://scienmag.com/new-1-km-global-groundwater-dataset-brings-hidden-aquifer-changes-into-view/
Violet Maxwell. "New 1 km global groundwater dataset brings hidden aquifer changes into view." Scienmag, 19 October 2026, https://scienmag.com/new-1-km-global-groundwater-dataset-brings-hidden-aquifer-changes-into-view/. Accessed 19 October 2026.
Violet Maxwell. "New 1 km global groundwater dataset brings hidden aquifer changes into view." Scienmag. October 19, 2026. https://scienmag.com/new-1-km-global-groundwater-dataset-brings-hidden-aquifer-changes-into-view/


