


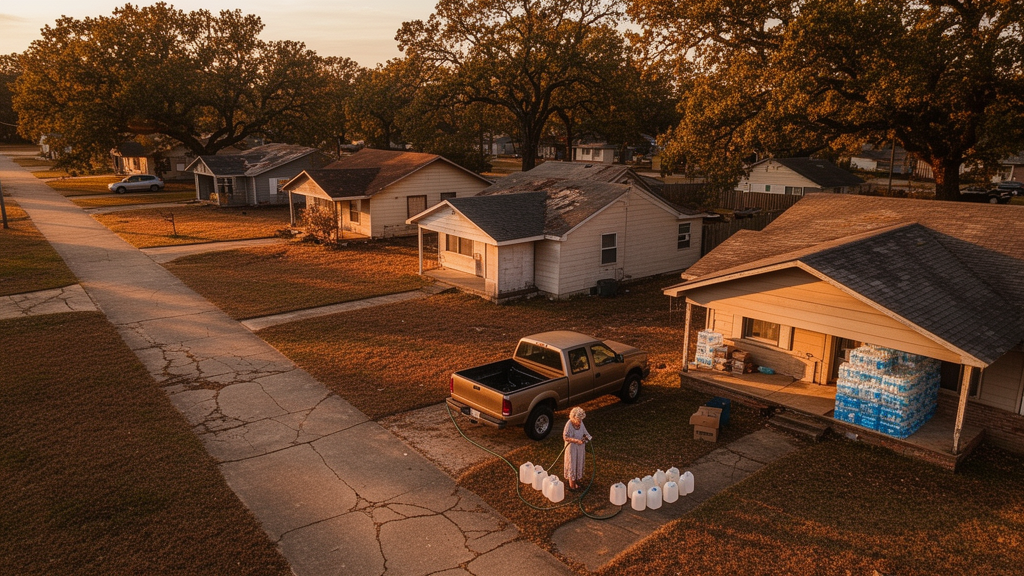
When the water system in Jackson, Mississippi, fails, the failure rarely arrives alone or at random. A new study published in Discover Cities has transformed nearly a decade of boil water notices into a block-by-block map of urban water hardship, and the resulting geography is strikingly uneven. Between 2016 and 2024, the advisories that told residents to boil tap water before drinking, cooking, or brushing their teeth did not scatter randomly across the city. Instead, they clustered persistently in southern Jackson and portions of the urban core, precisely where concentrations of older adults, Black residents, people living below the poverty line, and residents with lower educational attainment are highest. The analysis, conducted by Tanmoy Malaker and Qingmin Meng of Mississippi State University, offers some of the finest-grained evidence yet that recurring water service disruption in an American city overlaps with existing socioeconomic vulnerability.
The technical achievement underlying the study is considerable. Boil water notices are issued and revoked in real time by the Mississippi State Department of Health and are not routinely archived in a form suitable for spatial analysis. The researchers obtained the historical records through a formal data request, but the dataset consisted of little more than street names and notice dates in plain text. To convert this textual archive into something a geographic information system could interrogate, the team built a multistep geospatial workflow combining Python programming, OpenStreetMap, the U.S. Census Bureau TIGER/Line road network, and ArcGIS Pro. Street addresses were standardized, matched to road segments, cross-validated against multiple map sources, and buffered to identify nearby buildings drawn from a 2022 statewide building-footprint dataset. The census blocks containing those buildings were then classified as notice-affected. In total, 97.44 percent of the records were successfully matched to road segments; the remaining 2.56 percent, for which no reliable spatial match could be established, were excluded.
That conversion mattered because of a persistent mismatch in environmental justice research: the notices describe exposure at the scale of a street, while most socioeconomic data from the American Community Survey are published only at the coarser census block-group level. To harmonize the two, the researchers employed building-footprint-based dasymetric mapping, a technique that redistributes block-group demographic values to individual census blocks in proportion to the number of building footprints each block contains. The approach assumes that buildings reasonably represent where people actually live within a neighborhood, producing finer and more spatially representative population estimates than conventional areal weighting. Using this method, the team compiled 230 variables spanning ten dimensions of social vulnerability, including age and sex, income, race, poverty, employment, marital status, health insurance coverage, relocation status, building age, and building value, all resolved to the census block.
With the exposure and demographic layers aligned, the analysis turned to the Getis-Ord Gi* statistic, a local indicator of spatial association designed to detect statistically significant concentrations of high or low values. Unlike global measures such as Moran’s I, which summarize clustering for an entire study area with a single number, the Gi* statistic pinpoints where significant hot spots and cold spots actually occur. The researchers input annual boil water notice frequency for each census block, constructed a spatial weight matrix using the ten nearest neighbors with row-standardized weights, and generated standardized z-scores and p-values for every block. Positive, significant z-scores marked hot spots of recurring advisories; negative ones marked cold spots. The same procedure was applied to population counts and to each demographic variable, producing parallel hot spot layers that could be compared directly.
The comparison itself relied on the Hot Spot Analysis Comparison tool in ArcGIS Pro, run with 9,999 permutations and fuzzy similarity weighting. Two complementary statistics quantified the spatial correspondence between notice hot spots and demographic hot spots. The Similarity Value, ranging from 0 to 1, measures how often corresponding blocks fall into the same significance category, while the Spatial Fuzzy Kappa, ranging from -1 to 1, controls for chance agreement and tolerates uncertainty in the exact correspondence of neighboring locations. Crucially, the researchers excluded pairs of blocks where both layers were statistically nonsignificant, ensuring the similarity measures were conditional on significant clusters rather than dominated by the many blocks where neither notices nor a given demographic group clustered. The output classified each block into categories such as Hot-to-Hot, meaning a demographic hot spot coinciding with a notice hot spot, or Cold-to-Hot, meaning a group concentrated in areas the advisories avoided.
The results reveal a clear hierarchy of vulnerability. Older adults aged sixty and older exhibited the strongest and most persistent spatial association with recurring notice hot spots of any group examined. In 2017, 12,203 older adults lived within Hot-to-Hot clusters; by the partial 2024 observation period, covering January through August, that figure had risen to 17,997. Children under five also showed recurring clustering, particularly in southern Jackson, with the greatest spatial extent in 2020 and the largest Hot-to-Hot population in 2017 at 6,978 individuals. But across the study period, the older population demonstrated greater temporal persistence and spatial overlap with notice hot spots, making them the most consistently associated age group in the analysis.
Economic and educational gradients followed a similar pattern. Residents living below the poverty line consistently represented the most affected income group, and their numbers within affected blocks increased over time, reaching their highest level in 2024 despite the dataset covering only eight months of that year. Hot-to-Hot clusters of poverty concentrations and notice hot spots recurred in southern and central Jackson, with the largest populations observed in 2018 and 2022. Individuals with a high school diploma, GED, or incomplete college education likewise showed recurring Hot-to-Hot clustering, while doctoral and professional degree holders were the least affected groups. High-income populations, concentrated primarily in northeastern Jackson, displayed a contrasting profile: their significant Hot-to-Hot clusters were intermittent, and Cold-to-Hot categories occurred more frequently in northern portions of the city, indicating concentrations of affluent residents in areas comparatively spared by the advisories.
Racial patterns demand careful interpretation, and the authors are explicit about the distinction between spatial coincidence and disproportionate exposure. Black residents constitute approximately 81.8 percent of Jackson’s population, so larger absolute numbers of Black residents within Hot-to-Hot areas partly reflect their overall representation in the city. Recurring Hot-to-Hot clusters between Black population hot spots and notice hot spots were concentrated in southern Jackson and persisted across multiple years, with the largest counts in 2017, 2023, and the partial 2024 period, while White population hot spots, concentrated in the northeast, showed greater temporal variability. Among smaller groups, multiracial residents represented the largest minority population within Hot-to-Hot areas in selected years, and Hispanic residents, largely captured by the Other Race Alone category, demonstrated the most temporally persistent clustering among minorities, recurring in most years except 2018. When the researchers normalized exposure by each group’s total population, Black residents’ proportional affected rates were not consistently the highest, underscoring that the findings indicate recurring coincidence rather than proven racial disparity.
The theoretical framing situates these patterns within environmental justice and urban political ecology. Environmental justice scholarship has long emphasized the unequal distribution of environmental burdens across racial and socioeconomic groups, while urban political ecology examines how political, economic, and institutional processes, including historical investment and disinvestment, shape uneven urban environments. From this perspective, recurring boil water notices are not isolated infrastructure failures but manifestations of broader socio-spatial inequality, the product of decades of underinvestment, aging infrastructure, population decline, a shrinking municipal revenue base, workforce shortages, and deferred maintenance. Jackson issued more than 750 boil water notices between 2016 and 2020 alone, and the widely publicized 2022 crisis, when failures at the O.B. Curtis Water Treatment Plant left more than 150,000 residents without reliable drinking water, was the culmination of a long-term process rather than a singular event.
The practical implications extend beyond Jackson. The authors argue that historical notice patterns could help utilities identify neighborhoods for infrastructure inspection, pipe-condition assessment, preventive maintenance, and capital improvements, shifting water service management from reactive crisis response toward proactive, geographically targeted planning. Where persistent notice clustering overlaps with vulnerable populations, physical interventions could be complemented by targeted risk communication, accessible emergency water distribution, and assistance obtaining alternative water. The framework is explicitly transferable: any city with archived advisory records could reconstruct its own geography of water hardship and identify the communities disproportionately affected. The authors caution that their statistics measure spatial agreement, not causation, and that future work incorporating pipe age, material, maintenance history, pressure conditions, and failure records would clarify the mechanisms producing these patterns. But as climate change, urbanization, and deferred infrastructure investment intensify water insecurity in cities worldwide, the study demonstrates that the question of who endures recurring water hardship has an answer, and that answer can be mapped, measured, and acted upon.
Subject of Research: A geospatial study of boil water notices in Jackson, Mississippi, shows recurring water service disruptions spatially coincide with demographic vulnerability.
Article Title: Spatiotemporal analytics of demographic vulnerability to urban water hardship
Article References: Malaker, T., & Meng, Q. (2026). Spatiotemporal analytics of demographic vulnerability to urban water hardship. Discover Cities, 3(1), Article 203. https://doi.org/10.1007/s44327-026-00382-1
Image Credits: AI Generated
DOI: 10.1007/s44327-026-00382-1
Keywords: urban water insecurity, environmental justice, geospatial analysis, boil water notices, Jackson Mississippi, hot spot analysis, dasymetric mapping, water infrastructure, Spatiotemporal, analytics, demographic, vulnerability
Cite Scienmag News
Courtney Benton. (October 18, 2026). Mapping the Hidden Geography of Urban Water Hardship in Jackson, Mississippi. Scienmag. https://scienmag.com/mapping-the-hidden-geography-of-urban-water-hardship-in-jackson-mississippi/
Courtney Benton. "Mapping the Hidden Geography of Urban Water Hardship in Jackson, Mississippi." Scienmag, 18 October 2026, https://scienmag.com/mapping-the-hidden-geography-of-urban-water-hardship-in-jackson-mississippi/. Accessed 18 October 2026.
Courtney Benton. "Mapping the Hidden Geography of Urban Water Hardship in Jackson, Mississippi." Scienmag. October 18, 2026. https://scienmag.com/mapping-the-hidden-geography-of-urban-water-hardship-in-jackson-mississippi/


