


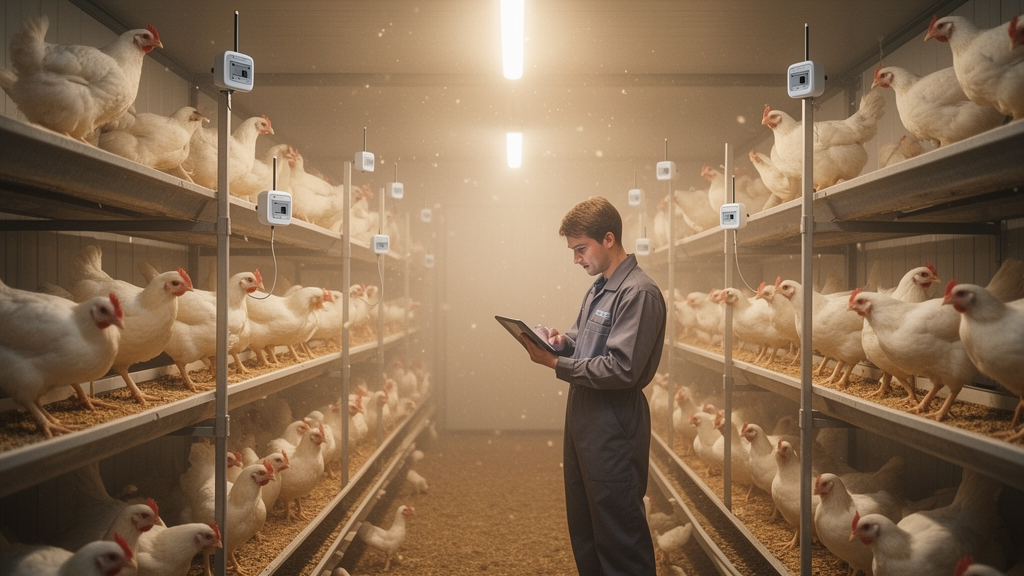
Inside a modern egg farm, the air that a hen breathes depends dramatically on where she happens to live in the building. A new field study from southern Brazil has mapped, in unprecedented three-dimensional detail, how temperature, humidity, and carbon dioxide vary across commercial multi-tier layer houses, revealing environmental hotspots that facility-wide averages would completely miss. The research, published in Smart Agricultural Technology, deployed a dense network of 72 Internet of Things sensing positions in each of two contrasting barns and tracked the microclimate continuously through an entire autumn campaign.
The study, led by Leonardo de Brito Andrade and Carlos Augusto de Paiva Sampaio, took place at a commercial egg-production complex in Vacaria, in the state of Rio Grande do Sul, a region with a temperate oceanic climate and pronounced daily thermal swings. Two closed houses with six-tier cage batteries were monitored simultaneously between April and May 2025. Barn A housed 75,600 Dekalb hens under a negative-pressure ventilation system, in which exhaust fans pull fresh air through sidewall inlets. Barn B housed 90,500 Bovans hens under a positive-pressure hybrid configuration, in which axial fans push air along service corridors and exhaust occurs passively through adjustable side curtains. Both flocks were about 18 months old and carried nearly identical bird loads per square meter of floor area, roughly 45 hens per square meter, making the comparison as fair as a two-barn observational study allows.
The sensing architecture was deliberately spatial rather than centralized. Each barn received 36 temperature and relative-humidity nodes and 36 alternating carbon dioxide nodes, arranged across three horizontal monitoring levels at 1.5, 2.5, and 3.5 meters above the floor. The nodes communicated over LoRaWAN to a gateway with Ethernet and 4G backhaul to a cloud repository, generating readings every five minutes. The carbon dioxide sensors used non-dispersive infrared detection with a manufacturer-reported accuracy of plus or minus 30 ppm plus 3 percent of reading. Because the buildings differed in size, the same topological design produced coarser sensor spacing in the larger Barn B, a limitation the authors handled through careful cross-validation of their spatial maps.
The researchers’ central methodological innovation was a diagnostic they call the Relative CO2 Dilution Index. Rather than estimating a conventional ventilation rate, which would require measuring supply and exhaust air concentrations that were not continuously available, the index compares the local excess carbon dioxide at each sensing position against a contemporaneous reference drawn from house-specific locations. Values above one indicate that a zone carries less excess carbon dioxide than the reference, while values below one flag zones where the contaminant burden is relatively heavier. The team explicitly tested how sensitive this index was to assumptions about the outdoor background concentration, to plausible spatial variation in the hens’ metabolic carbon dioxide production, and to sensor-specific measurement bias.
The thermal results were striking. During the matched monitoring window, outdoor temperatures cycled through a typical amplitude of 8.35 kelvin, from about 11.6 degrees Celsius at dawn to nearly 20 degrees in mid-afternoon. Barn A suppressed that cycle dramatically, with indoor temperatures varying by only 2.46 kelvin, a Thermal Amplitude Ratio of 0.29. Barn B, by contrast, tracked the outdoor rhythm much more closely, with an indoor amplitude of 6.42 kelvin and a ratio of 0.77. In other words, the negative-pressure house held its internal climate to less than a third of the external swing, while the positive-pressure hybrid house let nearly four-fifths of it through.
Vertical stratification told an equally compelling story. In Barn B, the temperature difference between the lowest and highest monitored levels reached 6.4 kelvin during the early morning and 8.3 kelvin at the afternoon peak, with the upper cage tiers consistently warmer than the floor zone. Barn A, in contrast, showed nearly negligible vertical gradients, at most a few tenths of a kelvin, and even a slight thermal inversion in the afternoon. Humidity followed a parallel pattern. In Barn B, upper-level relative humidity climbed to mean values of 91.5 percent in May, with absolute peaks approaching 99.8 percent, close to saturation and raising the potential for condensation on cooler surfaces. Barn B also accumulated moisture along its length, with relative humidity rising roughly 30 percentage points from the inlet end to the downstream region, while Barn A maintained a much gentler longitudinal progression.
Perhaps the most surprising finding concerned carbon dioxide. Conventional wisdom might expect contaminant concentrations to rise steadily with height as warm, contaminated air buoyantly accumulates near the ceiling. Instead, the intermediate cage level, at 2.5 meters, emerged as the recurrent carbon dioxide hotspot in both houses, in every targeted month-and-hour comparison. During nighttime minimum ventilation in May, Barn A’s middle level reached a mean of 1,736 ppm, well above the 1,614 ppm at the lowest level and 1,546 ppm at the top. Barn B showed the same intermediate maximum at lower absolute concentrations. The authors stress that without direct airflow measurements this pattern cannot be attributed to any specific mixing failure, but it demonstrates that contaminant distribution in multi-tier housing is not monotonic with height, a fact invisible to single-point or facility-average monitoring.
The robustness analyses give the findings considerable weight. When the researchers allowed every carbon dioxide sensor a fixed bias within the manufacturer’s accuracy envelope across 20,000 simulated realizations, the intermediate-level maximum persisted in at least 99.98 percent of cases for every house-month-hour combination. Varying the assumed outdoor background from 400 to 500 ppm changed the magnitude of the dilution index but never flipped whether a region sat above, near, or below unity. Interpolation of the spatial maps, validated by leaving out each sensor in turn, showed that inverse-distance weighting with a power of two delivered complete coverage and no overshoot, with cross-validated errors of about 0.75 degrees Celsius for temperature and 80 ppm for carbon dioxide.
The authors are careful about what their design can and cannot claim. With only one barn per ventilation configuration, house identity is inseparably confounded with pressure regime, building geometry, bird strain, and management style, so the contrasts describe two complete commercial cases rather than a causal test of negative versus positive pressure. Air velocity, ventilation rate, and actuator states were not measured, so airflow mechanisms remain physically plausible hypotheses. Physiological responses of the hens, ammonia emissions, manure moisture, and actual condensation events were also outside the measurement scope. The campaign covered only autumn conditions rather than a full production year.
Even with those caveats, the study delivers a practical message for the fast-growing precision livestock farming sector: environmental quality in dense multi-tier housing is a genuinely three-dimensional problem, and cheap, distributed IoT sensing can expose hidden zones of heat, moisture, and contaminant accumulation that traditional monitoring misses entirely. The framework, combining dense sensing with explicit uncertainty analysis, offers a template for future deployments that could incorporate airflow measurements, traceable sensor calibration, and animal-based welfare indicators, ultimately helping farmers target ventilation interventions exactly where the microclimate demands them.
Subject of Research: Spatial environmental heterogeneity and air-renewal diagnostics in commercial multi-tier poultry housing using IoT-based CO2 monitoring
Article Title: Spatial assessment of air-renewal heterogeneity in multi-tier layer houses using IoT-based CO 2 monitoring
Article References: Spatial assessment of air-renewal heterogeneity in multi-tier layer houses using IoT-based CO 2 monitoring. (n.d.). https://doi.org/10.1016/j.atech.2026.102610
Image Credits: AI Generated
DOI: Not provided
Keywords: precision livestock farming, Internet of Things, poultry housing, carbon dioxide monitoring, ventilation, multi-tier cages, microclimate, thermal stratification, relative humidity, air quality, LoRaWAN, layer hens
Cite Scienmag News
Alan Morgan. (October 15, 2026). IoT Sensor Grid Reveals Hidden Microclimates Inside Multi-Tier Layer Hen Houses. Scienmag. https://scienmag.com/iot-sensor-grid-reveals-hidden-microclimates-inside-multi-tier-layer-hen-houses/
Alan Morgan. "IoT Sensor Grid Reveals Hidden Microclimates Inside Multi-Tier Layer Hen Houses." Scienmag, 15 October 2026, https://scienmag.com/iot-sensor-grid-reveals-hidden-microclimates-inside-multi-tier-layer-hen-houses/. Accessed 15 October 2026.
Alan Morgan. "IoT Sensor Grid Reveals Hidden Microclimates Inside Multi-Tier Layer Hen Houses." Scienmag. October 15, 2026. https://scienmag.com/iot-sensor-grid-reveals-hidden-microclimates-inside-multi-tier-layer-hen-houses/


