


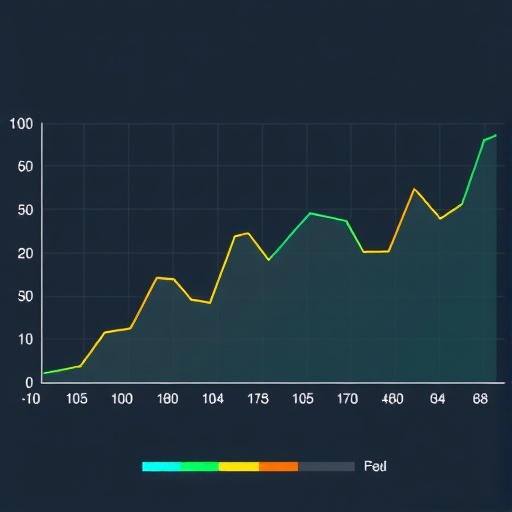
In the realm of data visualization, trust is often assumed to stem from clarity and accuracy of the presented information. However, groundbreaking research from the Massachusetts Institute of Technology (MIT) challenges this notion by revealing that the perceived trustworthiness of charts and graphs extends far beyond the explicit data they display. The degree to which viewers accept or reject a visualization is deeply intertwined with their assumptions about the creators behind those graphics, highlighting a complex social dimension of data interpretation.
This innovative study, conducted by a collaborative team of computer scientists and anthropologists at MIT, specifically investigated how design elements within data visualizations influence viewers’ judgments about the social and ideological identity of the graphic’s author. Their findings expose an underappreciated layer of communication wherein visualizations serve as social artifacts, simultaneously conveying implicit social signals about origin, intent, and credibility. Such signals can either bolster or erode trust in the underlying data, particularly when the topics are politically or culturally charged, such as gun violence or public health issues.
One particularly striking insight from the research is the power of design choices—colors, layout, iconography—to activate preconceived notions about who might have produced a chart. For example, viewers inferred political affiliations or institutional biases based merely on the presence of regional flags or the stylistic use of color palettes. These assessments were often not conscious or deliberate; instead, they emerged rapidly during initial exposure to the visualization, sometimes before any engagement with the actual data occurred. This phenomenon points to a socio-indexical functionality of visual language akin to how linguistic accents denote group identities and cultural backgrounds.
The interdisciplinary team undertook qualitative and quantitative research approaches to elucidate these patterns. Their initial investigation involved in-depth interviews with social media users on Tumblr, a platform recognized for its swift and often superficial content consumption. By stripping visualizations of textual cues such as titles and axis labels, the researchers mimicked the real-world experience of encountering charts in fleeting social media scrolls. Participants consistently made rapid social judgments based purely on non-verbal design cues—termed as “vibes”—conveyed through visual language, which in turn strongly influenced their trust in the data.
Building on these qualitative insights, the researchers expanded their work through controlled surveys involving diverse participant pools. Results reinforced the notion that social inferences triggered by design elements are neither peculiar to specific demographic groups nor attributable solely to deficiencies in data literacy. Indeed, such responses seem rooted in a culturally ingrained semiotics of data visualization, where signs and symbols carry meanings beyond their surface-level representation. For instance, a neatly organized chart was sometimes equated with commercial advertising and dismissed as untrustworthy, while a hand-drawn style evoked skepticism about professionalism and scientific rigor.
Significantly, these social interpretations did not dissipate with the reintroduction of textual context; rather, they coexisted with explicit information, suggesting that design-induced social perceptions operate in tandem with data comprehension. This complex interaction complicates traditional assumptions in data visualization, which often prioritize improving clarity or promoting statistical literacy as means to enhance trust. Instead, the MIT team advocates for a more nuanced understanding of “visualization literacy” that encompasses cultural knowledge about the provenance and social implications of graphical design.
To synthesize their findings, the researchers developed a classification framework that categorizes the types of social inferences viewers make and associates them with specific design features. This typology offers a critical tool for creators of data visualizations, enabling them to anticipate and strategically manage the social signals their work may inadvertently communicate. Such awareness could be transformative in scientific communication and public discourse, where visualizations routinely inform high-stakes societal decisions.
The impetus for this research traces back to the Covid-19 pandemic when public health charts proliferated across social media and other informal information channels. Here, the researchers observed not only broad dissemination but also the rise of citizen scientists repurposing and reinterpreting official data for alternative narratives, sometimes in opposition to mainstream science. This unexpected social dynamic underscored the urgency of exploring how visualizations function as communicative acts embedded within complex social ecosystems.
As data visualization continues to grow as a pivotal medium across disciplines, this work heralds a paradigm shift by foregrounding the social dimensions embedded within graphical communication. Beyond the technical mastery of chart construction, effective visualization now demands sensitivity to the social identities and institutional contexts that audiences unconsciously reference. Embracing this intersection of design, sociology, and anthropology could pave the way for more trustworthy and impactful visual storytelling.
Looking ahead, the MIT team plans to delve deeper into individual design elements to better understand their distinct socio-indexical roles. They are also keen to extend their inquiry into academic and scientific publications—domains where visualizations uphold critical authority yet may harbor unintended social signals. By bridging disciplinary boundaries, this research exemplifies MIT’s commitment to innovative, cross-pollinated scholarship that addresses real-world challenges in information dissemination.
The implications of these findings extend beyond academia into the realms of media, policy, and public engagement. Recognizing that visualizations are inherently social artifacts invites a more reflexive practice among designers, communicators, and consumers alike. It alerts us to the subtle ways visual language shapes discourse, trust, and ultimately, collective understanding in our increasingly data-driven society.
News Publication Date: (Not explicitly provided in the source content)
Web References: DOI 10.48550/arXiv.2508.06775
References: (Not explicitly provided in the source content)
Cite Scienmag News
Courtney Benton. (October 22, 2025). How Charts Serve as Social Artifacts Conveying More Than Just Data. Scienmag. https://scienmag.com/how-charts-serve-as-social-artifacts-conveying-more-than-just-data/
Courtney Benton. "How Charts Serve as Social Artifacts Conveying More Than Just Data." Scienmag, 22 October 2025, https://scienmag.com/how-charts-serve-as-social-artifacts-conveying-more-than-just-data/. Accessed 6 September 2026.
Courtney Benton. "How Charts Serve as Social Artifacts Conveying More Than Just Data." Scienmag. October 22, 2025. https://scienmag.com/how-charts-serve-as-social-artifacts-conveying-more-than-just-data/


