


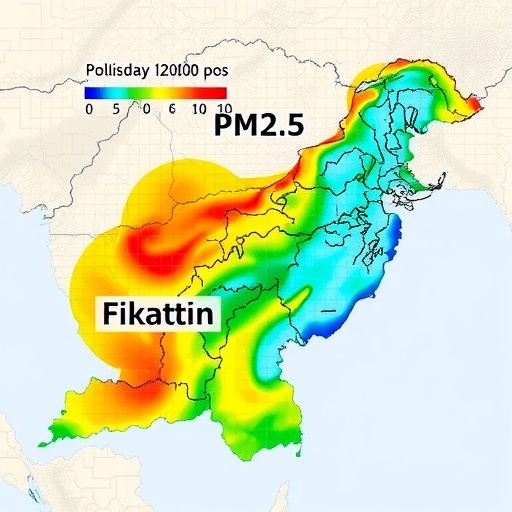
In the smog-choked plains of Punjab, in the thin mountain air of the Karakoram, and along the humid monsoon-soaked coasts of Sindh, the behavior of fine particulate pollution in Pakistan is not governed by a single rule. It changes with altitude, with season, and with the shifting mechanics of the atmosphere itself. A new study published in the journal Air Quality, Atmosphere & Health has now mapped those changes with an unprecedented level of detail, using a four-dimensional statistical framework that treats elevation as a first-class variable alongside latitude, longitude, and time.
The research, led by Atia Elahi of the University of Karachi together with Kamran Khan and Abdul Jameel Khan of Iqra University and Saqib Ur-Rehman of the University of Karachi, covers 161 districts of Pakistan over a twenty-four-year period from 1998 to 2021. Its central question is deceptively simple: how do the relationships between fine particulate matter, or PM2.5, and six key meteorological variables — precipitation, temperature, relative humidity, wind speed, surface pressure, and aerosol optical depth — vary across space, across seasons, and across the country’s dramatic topographic gradient, which stretches from sea level to some of the highest peaks on Earth?
The answer, the authors report, is that these relationships vary enormously, and that capturing that variation requires a statistical instrument purpose-built for the task. The method they developed, called 4D-GTWR, extends an established technique known as geographically and temporally weighted regression, or GTWR, by explicitly adding elevation to the spatiotemporal weighting function. In conventional GTWR, regression coefficients are recalculated for every location and time point, weighted by proximity in space and time, so that relationships can differ from one district to the next and from one month to another. The Pakistani team’s innovation is to make the weight between two observations depend not just on how far apart they are horizontally and chronologically, but also on how different their elevations are. The logic is physical as much as mathematical: the processes that control whether a molecule of pollution accumulates or disperses behave very differently at 200 meters above sea level than at 2,000 meters, so observations from the valley floor should not carry the same influence over a mountain district as they do over a neighboring plain.
The stakes of this modeling challenge are not abstract. PM2.5 — particles smaller than 2.5 micrometers in diameter — is among the most consequential environmental health hazards in the world. Because of its tiny size, it penetrates deep into the lungs, crosses into the bloodstream, and is linked to cardiovascular disease, respiratory illness, cancer, and premature death. Pakistan consistently ranks among the countries with the worst air quality on the planet, with Lahore and other Punjabi cities regularly topping global rankings for pollution during the winter smog season. Meteorology plays a central role in those episodes: temperature inversions trap cold air and its pollutant load in valley basins, low wind speeds allow particles to accumulate rather than disperse, and humidity drives hygroscopic growth of particles, increasing both their mass and their optical signature. Conversely, monsoon rainfall washes particles from the atmosphere, and the summer monsoon season often brings a respite — a pattern the new analysis confirms quantitatively.
The data underpinning the study combine satellite-derived PM2.5 and aerosol optical depth, the standard proxy for aerosol loading measured by instruments observing how much sunlight particles scatter, with meteorological fields from modern reanalysis datasets that blend observations with numerical weather models. The districts of Pakistan form the spatial units, and the seasons are defined in the conventional climatological shorthand: DJF for December, January, and February, the winter smog months; MAM for March, April, and May, the spring; JJA for June, July, and August, the summer monsoon; and SON for September, October, and November, the post-monsoon autumn.
When the 4D-GTWR model was fitted to those data, its performance against traditional alternatives was striking. The model explained roughly 70.28 percent of the variance in PM2.5 during winter, 80.70 percent during spring, 80.87 percent during the summer monsoon, and 72.41 percent during autumn. Those seasonal coefficients of determination were consistently higher than those achieved by ordinary least squares regression, the classical global model that assumes one set of relationships holds everywhere, and by standard GTWR, which accounts for space and time but not altitude. Equally important, the residuals — the portion of variability the model fails to explain — showed less spatial autocorrelation, measured by Moran’s I, a statistic that detects whether errors cluster geographically in ways that signal missing structure. A model that leaves a coherent spatial pattern in its errors is, in effect, telling the researcher what it has overlooked. The lower Moran’s I of the 4D-GTWR residuals indicates that including elevation absorbed a substantial part of that missing structure.
What does the model reveal about the physical system? The authors describe significant seasonal and regional variation in how meteorology drives PM2.5, with distinctly different responses in the plains, the mountains, and the monsoon-influenced zones of the country. In the Indo-Gangetic plains of central Punjab and Sindh, where much of the population and industry is concentrated, winter relationships dominate: cool, stagnant conditions, weak winds, and high surface pressure combine with intense emissions from heating, traffic, and seasonal crop residue burning across the border to build the notorious smog episodes. In these lowland districts, the local coefficients — the district-specific slopes the model estimates for each meteorological variable — paint a picture of an atmosphere primed for accumulation, with humidity and pressure conditions amplifying particle persistence.
In the northern mountainous regions, the picture changes. There, elevation modifies everything: temperatures fall steeply with height, precipitation arrives as snow as often as rain, valley winds follow terrain channels rather than broad synoptic patterns, and the boundary layer — the lowest slice of the atmosphere where pollution mixes — is compressed and sometimes sealed by cold-air pools. Studies of mountain valleys elsewhere have shown that persistent, multi-day inversions can lock PM2.5 in place for days or weeks, and the Pakistani analysis confirms that the coefficients linking meteorology to pollution in such terrain differ systematically from those in the plains. This is precisely the effect that the fourth dimension of the new model is designed to capture: a temperature-PM2.5 relationship calibrated in Lahore is not transferable to Gilgit, and the model now knows that.
The monsoon regions add a third regime. During JJA, the model achieved its highest explanatory power at nearly 81 percent, reflecting the fact that during the monsoon, rainfall acts as a powerful scavenger of particulate matter, removing aerosols through wet deposition. The dynamics of monsoon onset and withdrawal therefore impose a strong temporal structure on PM2.5 in southern and central Pakistan that the model tracks season by season.
The aerosol optical depth variable deserves particular mention. AOD serves as both a predictor and a physically grounded link to satellite observation: it measures the column-integrated extinction of light by particles and correlates with surface PM2.5, though the relationship is modulated by humidity, vertical mixing, and the height of the aerosol layer. In Pakistan, where ground-based monitoring networks remain sparse, satellite-based estimation of surface PM2.5 is the practical foundation of any national assessment, and the local coefficients of the AOD-PM2.5 relationship are exactly the kind of quantity that varies with elevation and season — hygroscopic growth in humid lowland air increases the mass associated with a given optical depth, while dry mountain air attenuates the linkage. The 4D-GTWR framework quantifies this heterogeneity directly.
The authors frame the work as a foundation for air quality management tailored to geography and season rather than imposed as a one-size-fits-all national policy. The implication is concrete: mitigation strategies for the winter smog of the plains — controls on burning, vehicle emissions, and heating fuels, alongside inversion-aware forecasting — will not look like the strategies suited to monsoon-season dynamics in coastal districts or to the terrain-governed pollution of mountain valleys. A framework that knows how the drivers of pollution differ from one district and season to the next can support targeted interventions, seasonal early-warning systems, and more credible estimates of the health burden that PM2.5 imposes on Pakistan’s more than 240 million residents.
The study’s coverage is also notable in itself. Twenty-four years of data, from 1998 to 2021, spans an era during which Pakistan’s urban population grew rapidly, vehicle fleets multiplied, and transboundary pollution flows from the neighboring agricultural regions intensified. The long record allows the model to average over year-to-year anomalies in the monsoon and the winter climate, producing coefficient estimates that are robust to single exceptional seasons.
For the international research community, the demonstration that adding a fourth dimension to spatiotemporal regression improves both fit and residual structure offers a transferable methodological lesson. Any region with significant topographic relief — from the Andes to the Himalayas to the mountain basins of the American West — faces the same challenge: meteorological drivers of pollution are not spatially stationary, and altitude is one of the strongest organizers of that nonstationarity. The Pakistani team’s 4D-GTWR, validated across nearly a quarter century of data and four distinct seasons, provides a template for capturing it.
As South Asia’s air quality crisis deepens and climate change reshapes the monsoon and winter circulation patterns that govern pollution accumulation, tools of this kind move from academic interest to practical necessity. The four-dimensional picture that this study draws of Pakistan’s atmosphere is, in the end, a picture of what it takes to see a pollution problem clearly across one of the most topographically complex nations on Earth.
Cite Scienmag News
Russell Cooper. (September 10, 2026). New 4D model reveals how climate and terrain shape Pakistan’s PM2.5 pollution. Scienmag. https://scienmag.com/new-4d-model-reveals-how-climate-and-terrain-shape-pakistans-pm2-5-pollution/
Russell Cooper. "New 4D model reveals how climate and terrain shape Pakistan’s PM2.5 pollution." Scienmag, 10 September 2026, https://scienmag.com/new-4d-model-reveals-how-climate-and-terrain-shape-pakistans-pm2-5-pollution/. Accessed 10 September 2026.
Russell Cooper. "New 4D model reveals how climate and terrain shape Pakistan’s PM2.5 pollution." Scienmag. September 10, 2026. https://scienmag.com/new-4d-model-reveals-how-climate-and-terrain-shape-pakistans-pm2-5-pollution/


