


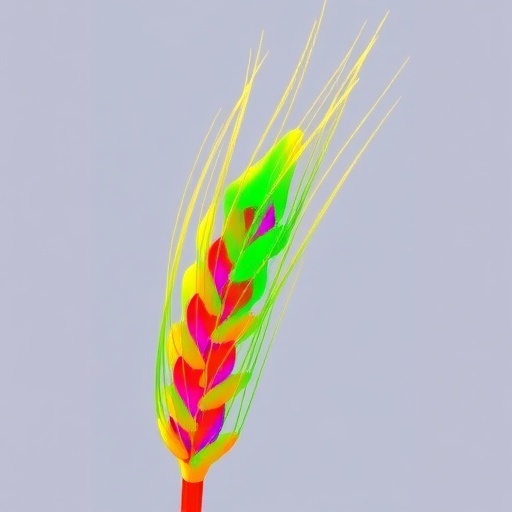
Wheat feeds billions, and the shape of its spike, the flowering head that carries the grain, is one of the most important yet stubbornly difficult traits to measure in crop science. Now, researchers at Rothamsted Research in the United Kingdom have built a high-resolution three-dimensional surface scanning pipeline that captures the architecture of individual wheat spikes in extraordinary detail, extracting dozens of new morphological descriptors that could transform how breeders screen for yield potential. The study, published in Plant Methods, demonstrates that laboratory-grade 3D scanning of a humble wheat head can deliver accurate, reproducible, and biologically meaningful measurements across dramatically different wheat genotypes.
The motivation behind the work is simple but consequential. Spike morphology is directly linked to key yield components such as grain number and grain weight. Traits including spikelet number per spike, spike length, spike density, spike compactness, and the presence of awns, the bristle-like appendages that extend from spikelets, are known from quantitative trait locus mapping and genome-wide association studies to be governed by multiple genetic loci. Breeders who can measure these traits quickly and precisely can more efficiently select lines with superior architecture. Yet the traditional toolkit remains rudimentary: rulers, calipers, and hand counting, which are slow, error-prone, and utterly unsuitable for the large-scale phenotyping that modern genetics demands.
Two-dimensional imaging has made inroads. Computer vision systems using RGB cameras can count spikelets in field images, estimate grain size, and classify spikes by shape using tools such as the Quadrangle model, which extracts area, length, width, perimeter, roundness, and circularity from flat photographs. But the Rothamsted team, led by Latifa Greche together with Nicolas Virlet and Malcolm J. Hawkesford, argues that 2D imaging fundamentally cannot capture the true complexity of a spike. Features such as three-dimensional curvature, surface variation, and how thickness changes along the rachis, the central stem of the spike, are either underrepresented or invisible in flat projections. X-ray computed tomography can reveal internal and external structure, but it is hampered by enormous data volumes, low throughput, and heavy computational demands. Field-based laser scanning and photogrammetry struggle with occlusion, since in dense plots only the spikes of taller tillers are fully exposed, biasing phenotypic data because longer tillers are known to support larger spikes.
The new pipeline sidesteps these problems by bringing harvested spikes, one at a time, to a high-resolution 3D surface scanner. The instrument used, an Artec Space Spider, combines three depth cameras, a 1.3-megapixel RGB camera, six LEDs, and a blue light projector capable of resolutions down to 0.1 millimeters. Blue light is chosen deliberately: its shorter wavelength diffracts more sharply around fine details, allowing the scanner to resolve tiny variations in spike surface geometry. During scanning, a spike is fixed to a rotating turntable that completes a full rotation in sixty seconds. The projector casts a grid pattern of structured light onto the spike, the three depth cameras observe the resulting distorted grid from different angles, and by comparing the reference pattern with the deformed one through triangulation, along with time-of-flight measurements of the reflected light, the system computes the precise three-dimensional position of points across the spike surface. Depending on spike size and complexity, from a few hundred to over a thousand frames may be captured, and long, bent, or awned spikes can take several minutes to scan completely as the operator tilts the scanner to reach hidden surfaces.
The raw frames then undergo a multi-step computational reconstruction. Global registration aligns all frames into a unified coordinate system by searching for matching pairs of geometric points within a one-millimeter window across consecutive frames. Next comes denoising: the algorithm measures, for each surface point, the mean distance to its fifty nearest neighbors and removes points whose mean distances exceed a threshold set at three standard deviations above the global mean. This conservative setting was chosen specifically to avoid deleting fine structural features such as awn tips, glume edges, and rachis branches, where point cloud density is naturally low. Surface reconstruction follows using a ball-pivoting technique, in which a virtual sphere of one-millimeter radius rolls across the point cloud, connecting points into triangular facets until a complete mesh of the spike surface emerges. Finally, texture mapping projects RGB color onto the mesh through UV unwrapping, weighting color contributions by the cosine of the viewing angle to reduce perspective distortion.
With the spike digitized, the real analytical work begins. Every spike is aligned into a common coordinate system using principal component analysis, which treats the point cloud as a set of samples and finds the axes of maximum variance. The first principal component, corresponding to the largest eigenvalue of the covariance matrix, naturally aligns with the rachis, and a pair of calculated rotation matrices tips this axis into vertical orientation. Length is then measured two ways: as simple vertical extent along the z-axis, and as a skeleton length derived by slicing the spike into fifty parallel planes, computing the centroid of each slice, and summing the Euclidean distances between adjacent centroids. For awned genotypes, this is nontrivial, because awns slice into the cutting planes and drag the computed centroid away from the rachis. The pipeline handles this by retaining only the largest connected component in each slice, filtering centroid outliers using a modified z-score criterion, and smoothing the surviving centroids with univariate splines. The two length methods agreed remarkably well, with a correlation coefficient of R-squared equal to 0.98 and a mean bias of just 3.45 millimeters, while the skeleton approach proved more accurate for curved spikes.
The most innovative contribution is the cross-sectional area profile. Each aligned spike is sliced into one hundred sections parallel to its base, and the area of each section is computed by decomposing it into tiny triangles. Plotting these areas along the spike’s length produces a curve that rises from the base, peaks near the midsection, and tapers toward the apex, but with small, characteristic fluctuations corresponding to spikelet edges and the gaps between them. Counting the local maxima and minima of this curve yields a descriptor called the number of local extremes, which correlates with spike length and, inversely, with spikelet density, suggesting it can serve as an indirect proxy for how tightly spikelets are packed. The profile also allows automatic segmentation of the spike into three biologically meaningful zones: the zone of aborted spikelets at the base, the fully developed base region, and the apex. The length of the aborted zone correlated significantly with the number of aborted spikelets counted by hand, validating the method as a non-destructive predictor of spikelet abortion, a phenomenon influenced by stress and resource competition that has long interested wheat physiologists.
To characterize overall spike shape quantitatively, the team fitted four statistical distributions to each area profile: skewed Gaussian, log-normal, gamma, and chi-squared curves. The fitted parameters translate directly into morphology. Skewness captures asymmetry between the base and apex, with values near zero in compact, symmetrical genotypes and values exceeding seventy in spikes with thick bases and slender tips. Scale parameters track the relative length of the well-developed region, amplitude scales with volume and weight, and the degrees of freedom of the chi-squared fit distinguish symmetric, sharply peaked profiles from long, tapering ones. Fitted curves achieved R-squared values above 0.8 for nearly all genotypes.
Volume was estimated three independent ways: by integrating the area under the spline-fitted cross-sectional curve, by voxelizing the mesh into half-cubic-millimeter voxels, and by the scanner’s proprietary software. All three methods correlated near-perfectly, with R-squared values of 0.99 or better. The area-under-the-curve approach is particularly attractive for scale, because once area profiles are extracted, volume can be computed from a simple vector of one hundred numbers without ever storing the full 3D mesh. Spike weight correlated strongly with volume across genotypes, with the landrace WATDE0323 showing the steepest weight-per-volume slope, hinting at efficient grain packing.
The final layer of analysis extracts branching topology. The spike mesh is voxelized and subjected to a topology-preserving three-dimensional thinning algorithm that peels away outer layers while preserving any voxel whose removal would break a branch or merge structures, ultimately leaving a one-voxel-thick skeleton of the rachis, glumes, lemmas, paleas, and awns. Nodes with three or more neighbors are labeled branch points, and nodes with exactly one neighbor are labeled endpoints, corresponding to the tips of spikelet components. These branching descriptors correlated strongly with base and apex area traits, spike weight, spikelet number, and the statistical fit parameters, confirming that more voluminous, heavier spikes are also structurally more complex.
When all extracted traits were projected into lower dimensions, supervised linear discriminant analysis separated the twelve genotypes, eleven landraces from the historic Watkins collection plus the modern cultivar Paragon, into well-defined clusters, demonstrating that the descriptors carry real discriminatory information about long, short, compact, and awned spike architectures. The authors caution that the number of spikes analyzed per genotype was relatively small, and that the primary goal was to build and validate the pipeline rather than to make definitive genetic inferences. The code and sample data have been released openly on GitHub, and future work will scale the approach to larger panels, link the new traits to genetic variation, and explore whether field-based and developmental applications can capture how spike architecture changes dynamically as the crop grows. For a discipline long constrained by rulers and counting trays, the message is clear: the third dimension of wheat breeding has officially arrived.
Cite Scienmag News
Alan Morgan. (September 10, 2026). High-resolution 3D scanning quantifies wheat spike morphology. Scienmag. https://scienmag.com/high-resolution-3d-scanning-quantifies-wheat-spike-morphology/
Alan Morgan. "High-resolution 3D scanning quantifies wheat spike morphology." Scienmag, 10 September 2026, https://scienmag.com/high-resolution-3d-scanning-quantifies-wheat-spike-morphology/. Accessed 10 September 2026.
Alan Morgan. "High-resolution 3D scanning quantifies wheat spike morphology." Scienmag. September 10, 2026. https://scienmag.com/high-resolution-3d-scanning-quantifies-wheat-spike-morphology/


