


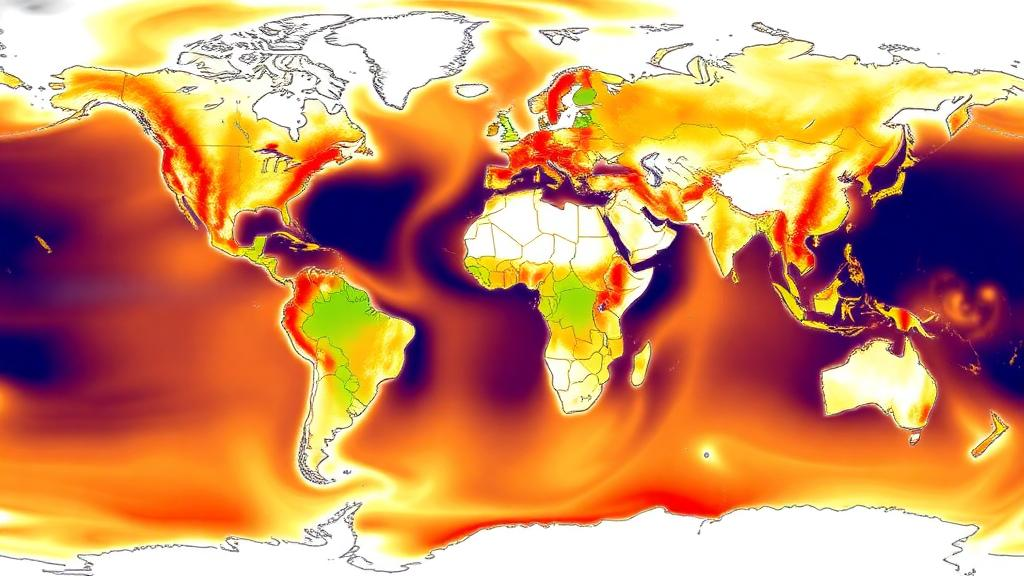
Were 2023 and 2024 merely the two warmest years on record, or do they mark the beginning of something more ominous: a genuine acceleration in the pace of global warming? The question has divided climate scientists, spawned heated exchanges in the literature, and captured headlines around the world. Now a new study published in Nature Communications offers a fresh and unexpectedly nuanced answer. Rather than asking whether the global average temperature curve has bent upward, a team led by Claudie Beaulieu of the University of California, Santa Cruz, went hunting for the fingerprints of acceleration region by region, grid cell by grid cell, across five independent surface temperature datasets spanning 1970 to 2024. What they found is neither a universal speed-up nor a comforting status quo, but a patchwork of coherent space-time systems in which the rate of warming has measurably changed, with timings scattered across four decades.
The stakes of this debate are considerable. The record-shattering temperatures of 2023 and 2024, the warmest since global observations began in 1850, have prompted competing explanations. One camp points to the transition from a prolonged La Niña to a strong El Niño as sufficient to explain the annual spike, a conclusion supported by work attributing the 2023 warming surge largely to El Niño Southern Oscillation dynamics. Others counter that the extraordinary monthly anomaly of September 2023 is extremely unlikely to arise from internal variability and greenhouse gas forcing alone, pointing instead to possible additional contributors such as the Hunga Tonga volcanic eruption or a record-low planetary albedo. A third hypothesis holds that warming has genuinely accelerated since around 2010, driven by a growing Earth energy imbalance as cooling aerosols decline.
The aerosol story is particularly compelling. The 2020 International Maritime Organization regulation sharply limited sulfur in shipping fuel, abruptly removing reflective ship-track particles that had been masking warming over the oceans. Meanwhile, China’s sulfur dioxide emissions from coal-fired power plants and industry have fallen since 2007, and Mexico has announced plans to cut aerosol emissions by 2030. Because aerosol changes are regionally constrained and short-lived compared with carbon dioxide, their climate fingerprints should appear as localized, relatively sudden shifts in warming rates, precisely the kind of signal a changepoint analysis is designed to detect. Yet when researchers examine the global mean surface temperature, an acceleration circa 2010 is not yet statistically detectable, and additional years of observations are needed to separate a true change in rate from natural variability.
Beaulieu and colleagues sidestepped the global average entirely. Their starting point is the recognition that Earth’s climate response to anthropogenic forcing is profoundly uneven. Land warms faster than ocean even at equilibrium, owing to differences in heat capacity, evaporative cooling, atmospheric moisture transport, and lapse-rate feedbacks. Beyond that familiar contrast, ocean and atmospheric circulation can hold some regions cooler or warmer than the global average, while changes in albedo, sea ice, and meltwater reshape warming at high latitudes, and regional aerosol emissions modulate radiative forcing locally. The rate of surface warming also fluctuates on interannual to multidecadal timescales through volcanic eruptions, solar variability, and natural modes of variability. The team chose 1970 as their starting date because it marks the well-documented global acceleration driven by rapidly rising radiative forcing, while avoiding the data sparsity and biases of earlier decades.
The methodological core of the study is changepoint detection, a statistical technique that fits piecewise linear models to annual temperature time series and asks whether the slope changes at some point in time. The researchers applied this machinery to every grid cell in five gridded datasets: Berkeley Earth, NASA’s GISTEMP, NOAA’s global temperature analysis, the Hadley Centre and Climatic Research Unit’s HadCRUT, and the globally infilled DCENT-I dataset. Their models assume that natural variability behaves as a first-order autoregressive process, a short-term memory that decays exponentially, and that changes in warming rate can be represented as shifts between linear segments. Model selection relied on the Bayesian Information Criterion penalty, chosen for its strong performance in controlling false detections while retaining detection power, and optimization used the PELT dynamic programming algorithm with a minimum segment length of ten years.
The results are striking in their coherence. Between four and ten percent of grid cells showed at least one detectable change in the rate of warming, and the timings and locations of those changes were largely consistent across all five datasets. The detected changes were predominantly accelerations or shifts from cooling toward warming, and they clustered overwhelmingly at mid-latitudes of the Northern Hemisphere. Over land, changes were almost exclusively accelerations, occurring in every decade since the 1970s. Over the ocean, the picture was more mixed: the Northern Hemisphere showed mostly accelerations, while the Southern Hemisphere experienced slowdowns and speed-ups in roughly equal measure, with warming slowdowns concentrated in the Southern Ocean during the 1980s. Crucially, the findings confirm that a global-scale acceleration since 1970 is not yet detectable, even when the record is extended through 2024.
Seven regions emerged as robust hotspots of change, appearing in most or all datasets. In the 1980s and 1990s, widespread changes appeared in the eastern Mediterranean and the North Pacific. An acceleration along and around New Zealand was detected in the 2000s. Most dramatically, the 2010s brought accelerations in southeast Mexico and the Gulf of Mexico, in Bolivia, and in southeast China. Some of these shifts are steep: the southeast Mexico region shows roughly a tenfold increase in warming rate after 2012, and southeast China on the order of a fivefold increase after 2013. In the southeast China case, the changepoint was detected at 2014, with the trend jumping from about 0.025 to 0.123 degrees Celsius per year, and the largest changepoint energy in the study, a signal-to-noise ratio of 2.6, reflecting changes in both trend and variance.
The timing of these regional accelerations offers tantalizing, though not yet conclusive, links to aerosol reductions. The post-2010 accelerations in the Gulf of Mexico, southeast Mexico, and southeast China are potentially consistent with regionally constrained, short-lived aerosol-driven changes, given documented declines in Chinese sulfur dioxide emissions and Mexican clean-air commitments. The late-1980s acceleration in the eastern Mediterranean aligns with regional aerosol reductions and the brightening observed after the 1990s. However, the authors are careful to note that internal variability could also contribute. A phase shift of the Pacific Decadal Oscillation toward its positive phase is associated with enhanced warming over the North Pacific and western Americas, and Atlantic Multidecadal Variability could project onto changes in the North Atlantic region. The 1980s Southern Ocean slowdowns, meanwhile, have been attributed to wind-driven northward sea-ice transport and freshwater forcing from melting Antarctic ice. Formal attribution remains future work.
The study also confronts its own limitations with unusual candor. A relaxed statistical penalty makes changepoints easier to detect but inflates false positives, so the researchers stuck with the stricter criterion. A complementary quadratic-trend analysis confirmed most of the same regions, suggesting the results are robust to how acceleration is defined. Because long-memory statistical behavior is more prevalent over oceans than land, the North Pacific findings warrant particular caution. The datasets differ in how they handle sea ice, and the combined land-ocean products examined here span a narrower range of sea surface temperature trend behavior than the full family of SST datasets. All datasets were independently corrected for inhomogeneities, reducing but not eliminating the risk that measurement changes could masquerade as climatic shifts.
What the study ultimately delivers is a reframing of the acceleration debate. The global average, by smoothing over regional complexity, may simply be the wrong lens for detecting a phenomenon whose signals are spatially scattered and temporally staggered from the 1980s to the 2010s. The affected regions account for less than ten percent of the analyzed grid cells, but many are densely populated and economically vulnerable, and ecosystems respond far more sharply to rapid change than to gradual warming. Monitoring where and when the pace of warming shifts is therefore not an academic exercise but a practical input for adaptation planning. As the authors suggest, the next step is to confront climate model simulations with these observed space-time signatures, testing whether models reproduce the same regional accelerations, and finally pinning down the causes of the changes now clearly visible in the record.
Subject of Research: Regional detection of surface warming accelerations and their timing since 1970 using changepoint analysis of multiple temperature datasets
Article Title: Space-time signatures of surface warming accelerations since 1970
Article References: Beaulieu, C., Johnson, A., Killick, R., Lanzante, J., & Knutson, T. (2026). Space-time signatures of surface warming accelerations since 1970. Nature Communications, 17(1), Article 9742. https://doi.org/10.1038/s41467-026-77514-z
Image Credits: AI Generated
DOI: 10.1038/s41467-026-77514-z
Keywords: climate change, global warming acceleration, changepoint detection, surface temperature, aerosols, El Nino Southern Oscillation, Pacific Decadal Oscillation, Southern Ocean, Nature Communications, climate variability, radiative forcing, regional warming
Cite Scienmag News
Violet Maxwell. (October 12, 2026). Where Is Warming Speeding Up? New Maps Reveal Regional Hotspots of Acceleration. Scienmag. https://scienmag.com/where-is-warming-speeding-up-new-maps-reveal-regional-hotspots-of-acceleration/
Violet Maxwell. "Where Is Warming Speeding Up? New Maps Reveal Regional Hotspots of Acceleration." Scienmag, 12 October 2026, https://scienmag.com/where-is-warming-speeding-up-new-maps-reveal-regional-hotspots-of-acceleration/. Accessed 12 October 2026.
Violet Maxwell. "Where Is Warming Speeding Up? New Maps Reveal Regional Hotspots of Acceleration." Scienmag. October 12, 2026. https://scienmag.com/where-is-warming-speeding-up-new-maps-reveal-regional-hotspots-of-acceleration/


