


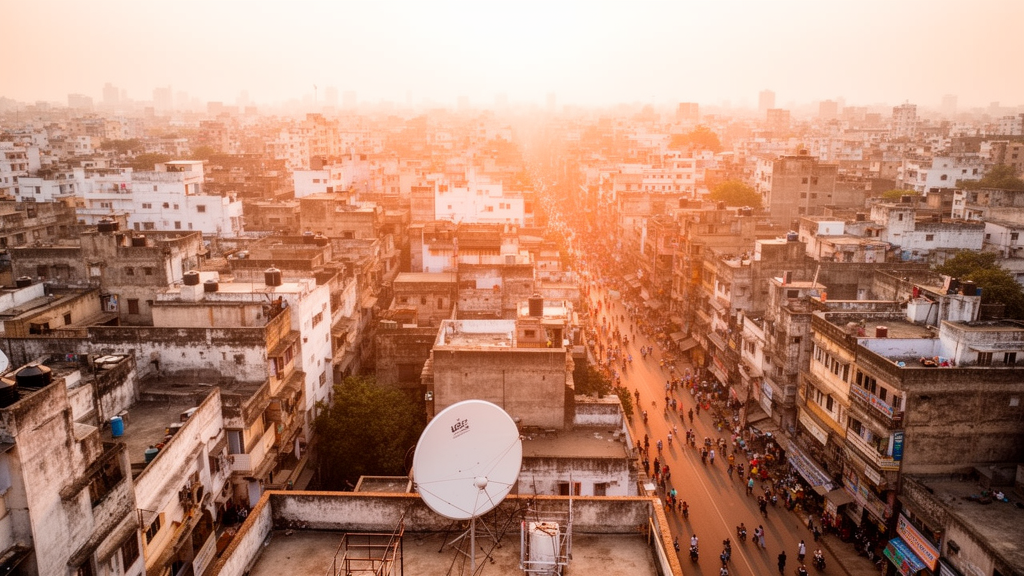
A twenty-year analysis of satellite imagery has documented a dramatic transformation in the thermal environment of Cuttack, one of eastern India’s oldest cities, where the average land surface temperature climbed from 30.89 degrees Celsius in 2004 to 42 degrees Celsius in 2024. The study, which tracked land use and land cover change across the city and its surrounding periphery using Landsat data from the United States Geological Survey, found that built-up area expanded by 50.52 percent over the two decades, growing from 48.95 square kilometres to 73.68 square kilometres. The researchers conclude that the combination of relentless construction, shrinking vegetation and water bodies, and the persistent presence of hot sandbars has pushed large portions of the city into zones of severe ecological stress.
The research team, led by Tanmaya Mallick, Sibabrata Das and Bubun Mahata, applied a supervised image classification method using the maximum likelihood algorithm to map six major land cover classes: vegetation, built-up land, water bodies, sandbars, barren land and agricultural land. Thermal conditions were assessed through two complementary measures, the Urban Heat Island level and the Urban Thermal Field Variance Index, known as UTFVI. The classification achieved overall accuracies of 86.68 percent for 2004, 89.31 percent for 2014 and 87.41 percent for 2024, with kappa coefficients above 0.80 in all three years, indicating exceptional agreement between the classified maps and reference data drawn from more than 200 sample points per year.
Within the city itself, built-up land rose from 34.67 percent of the area in 2004 to 48.78 percent by 2024, while agricultural land was cut roughly in half, falling from 10.33 percent to 5.11 percent. Barren land declined from 28.87 percent to 21.65 percent, largely absorbed by construction. Vegetation cover followed a more complicated trajectory, increasing from 13.87 percent in 2004 to 20.83 percent in 2014 before slipping back to 17.67 percent in 2024, a decline the authors attribute to recent development pressure. Water bodies remained nearly constant at around 3 percent of the city’s area throughout the study period.
The periphery told a different story. Built-up area there grew by 63.53 percent between 2004 and 2024, rising from 6.08 percent to 9.94 percent of the surrounding zone, which the study defines as land within a ten-kilometre radius of the city centre. Agricultural land in the periphery peaked at 31.25 percent in 2014 before falling sharply to 21.5 percent by 2024, a pattern the researchers interpret as the urban economy and infrastructure gradually displacing the rural way of life. Vegetation in the peripheral zone increased continuously across the two decades, while barren land expanded to become the dominant class by 2024.
The temperature record underlying these land changes is stark. Mean land surface temperature in the study area rose from 30.89 degrees Celsius in 2004 to 42.84 degrees Celsius in 2014, then eased slightly to 42.41 degrees Celsius in 2024, a marginal decrease of 0.43 degrees that the authors link to a continuing reduction in the area under sandbars. Even so, 2024 recorded the highest temperatures of the entire period. Maximum summer land surface temperature surged from 37.19 degrees Celsius in 2004 to approximately 55 degrees Celsius in both 2014 and 2024. In 2004, the hottest temperature band, between 34 and 38 degrees Celsius, covered just 5.80 percent of the city, while two-thirds of the area sat between 30 and 34 degrees. By 2014 and 2024, the band between 42 and 46 degrees dominated, covering 41.96 percent and 48.74 percent of the city respectively.
Land surface temperature, measured by satellite sensors as the radiant temperature of the ground, rooftops, vegetation, soil or water surfaces, differs from the air temperature recorded roughly two metres above the surface. When the researchers broke temperature statistics down by land cover class, sandbars emerged as the hottest surfaces in every year examined. Mean temperature over sandbars rose from 32.78 degrees Celsius in 2004 to 48.41 degrees in 2014 and 48.40 degrees in 2024, while built-up areas climbed from 30.72 degrees to 42.44 degrees over the same span. Water bodies remained the coolest surfaces, at 26.87 degrees in 2004 and 34.81 degrees in 2024, followed by barren land.
Correlation analysis revealed which land cover features exert the strongest control on the city’s temperature pattern. The relationship between land surface temperature and the Normalized Difference Built-up Index, or NDBI, was strongly positive, with the coefficient of determination rising from 0.4648 in 2004 to 0.575 in 2014, meaning that built-up extent explained a growing share of temperature variation. In contrast, the Modified Normalized Difference Water Index, which tracks open water, showed a consistently negative and strengthening association, with its coefficient of determination increasing from 0.4331 in 2004 to 0.5123 in 2024. The relationship between temperature and the vegetation index NDVI was very weak throughout, with values close to zero, suggesting that in this landscape other factors, including sandbars, exposed surfaces and the composition of land cover, outweigh vegetation alone in shaping the temperature field.
To sharpen the spatial picture, the team built a Random Forest regression model trained on roughly 5,000 sample points combining Sentinel-2 imagery, spectral indices for moisture, burn ratio and water content, and topographic variables derived from the Shuttle Radar Topography Mission, including elevation, slope and the Topographic Position Index. The model, tuned with 300 decision trees after testing five configurations, explained 83.3 percent of the spatial variation in land surface temperature on an independent test set of 752 samples, with a root mean square error of 1.85 degrees Celsius, a mean absolute error of 1.43 degrees and a negligible bias of 0.01 degrees. The shortwave infrared bands and moisture-related indices proved the most influential predictors, underscoring how strongly thermal and moisture conditions govern the surface temperature distribution. The predicted map placed extreme temperatures of 47.95 to 51 degrees Celsius over the sandbars, with high values of 41.99 to 47.94 degrees over built-up and barren land, and identified hotspots within the city itself at locations including Jobra, Jagatpur, Badambadi and Buxi Bazar.
The Urban Thermal Field Variance Index, which grades ecological comfort from none to strongest, revealed a deteriorating picture inside the city. Between 2014 and 2024, the share of the city falling into severe ecological stress, defined as a UTFVI value above 0.02, jumped from 32.46 percent to 40.73 percent, while ecologically better zones contracted from 56.85 percent to 45.64 percent. Across the wider study area, roughly 40 percent of the land now records a UTFVI value exceeding 0.02, a threshold the researchers associate with conditions uncomfortable for living. Although the highest UTFVI values cluster over the sandbars surrounding the city, warm and unfavourable zones have also spread through the urban interior, driven by the growth of built-up areas and the loss of vegetation and water bodies.
The authors frame their findings as a warning for medium-sized Indian cities, which they note often outpace existing infrastructure and planning as in-migration accelerates, unlike large metropolitan areas with greater capacity to absorb newcomers. Cuttack, the former capital of Odisha and home to 610,189 people at the 2011 census, has grown largely without vertical expansion and without achieving well-managed horizontal growth, leaving congested historic quarters where vegetation has been cleared for construction. The study acknowledges limitations, including the 30-metre resolution of Landsat data, which limits detection of fine-scale change, and the use of images from different dates within each study window owing to cloud cover and data availability. Even so, the researchers argue that the evidence points to an urgent need for urban greening, preservation of the city’s small historic water bodies, green corridors along streets and riverbanks, and climate adaptation strategies designed to restore ecological balance before rising heat makes more of the millennium-old city unfit for its residents.
Subject of Research: Land use change and the urban heat island effect in Cuttack City, India, analysed with remote sensing from 2004 to 2024
Article Title: Analysis of spatiotemporal dynamics of land use land cover pattern and Urban thermal environment in Cuttack City based on remote sensing data
Article References: Mallick, T., Das, S., & Mahata, B. (2026). Analysis of spatiotemporal dynamics of land use land cover pattern and Urban thermal environment in Cuttack City based on remote sensing data. Discover Cities, 3(1), Article 207. https://doi.org/10.1007/s44327-026-00386-x
Image Credits: AI Generated
DOI: 10.1007/s44327-026-00386-x
Keywords: urban heat island, land surface temperature, land use land cover, remote sensing, Cuttack, Landsat, NDVI, NDBI, MNDWI, UTFVI, Random Forest, urbanization
Cite Scienmag News
Courtney Benton. (October 23, 2026). Two Decades of Satellite Data Reveal Cuttack City’s Alarming Slide Into Extreme Urban Heat. Scienmag. https://scienmag.com/two-decades-of-satellite-data-reveal-cuttack-citys-alarming-slide-into-extreme-urban-heat/
Courtney Benton. "Two Decades of Satellite Data Reveal Cuttack City’s Alarming Slide Into Extreme Urban Heat." Scienmag, 23 October 2026, https://scienmag.com/two-decades-of-satellite-data-reveal-cuttack-citys-alarming-slide-into-extreme-urban-heat/. Accessed 23 October 2026.
Courtney Benton. "Two Decades of Satellite Data Reveal Cuttack City’s Alarming Slide Into Extreme Urban Heat." Scienmag. October 23, 2026. https://scienmag.com/two-decades-of-satellite-data-reveal-cuttack-citys-alarming-slide-into-extreme-urban-heat/


