


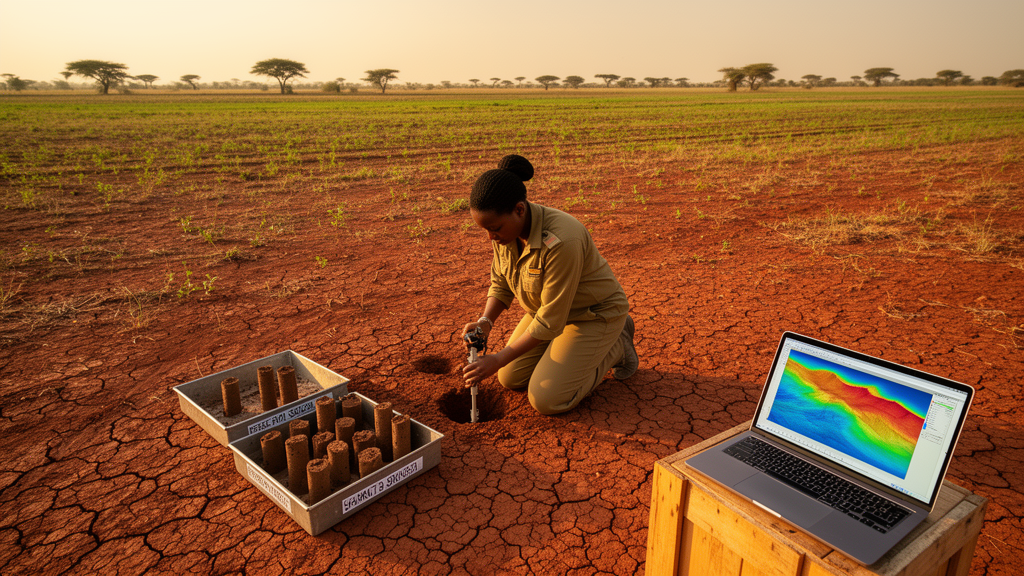
Deep beneath the cracking clay plains of Sudan’s Blue Nile region lies one of the planet’s least-charted carbon reservoirs — and a new study has finally drawn its map. Using a statistical technique called regression kriging, researchers have produced the first spatially explicit, validated picture of soil organic carbon stocks across roughly 38,000 square kilometers of Sudanese Vertisols, revealing where carbon is sequestered, where it has been lost, and where restoration efforts would pay off most. The work, published in the Spanish Journal of Soil Science, offers a technical blueprint that could reshape how semi-arid nations account for their soil carbon in a warming world.
Soil is the largest terrestrial carbon pool on Earth, storing an estimated 1,500 to 1,600 petagrams of carbon in its top meter — more than all vegetation and the atmosphere combined. Yet quantifying how much carbon sits in any given hectare of soil remains notoriously difficult, because organic carbon varies with soil type, climate, topography, vegetation, and land use. Sudan makes the challenge especially urgent: its central clay plain holds roughly 70 million hectares of Vertisols, about 16 percent of the global total, ranking the country third worldwide after India and Australia. These heavy, montmorillonite-dominated cracking clays are among the most fertile yet most fragile agricultural soils in the tropics.
The research team, led by Faroug A. H. Jadalla of the Pan African University Life and Earth Sciences Institute and the Agricultural Research Corporation in Wad Medani, assembled an extraordinary dataset: 2,235 soil samples spanning four decades, from 1981 to 2024. Rather than throwing the legacy data away, the team harmonized it with rigorous corrections. Walkley-Black wet digestion values were multiplied by 1.15 to match dry combustion equivalents, profiles were standardized to a common 0–30 centimeter depth using equal-area spline functions, and all stocks were corrected to an equivalent soil mass to remove bulk density artifacts. After screening out points with poor GPS accuracy or documented land-use change, 554 spatially unique, quality-controlled profiles remained for modeling.
Regression kriging works in two stages. First, a stepwise multiple linear regression relates measured SOC stocks to environmental covariates that satellites and terrain models can observe everywhere. Second, the residuals — the part of the variation the regression cannot explain — are interpolated with ordinary kriging, exploiting the spatial correlation of the leftover signal. The final prediction combines the deterministic trend with the stochastic residual surface. In this study, the regression equation included NDVI, clay content, a drought-modified wetness index, the bare soil index, and precipitation, achieving an adjusted R² of 0.64 with no multicollinearity issues.
The covariates themselves came from an impressive array of sources. Spectral indices were derived from Landsat 9 imagery captured in April 2024, coinciding with the contemporary soil survey. Climate data — precipitation, temperature, and relative humidity — came from CHIRPS v2.0 and WorldClim v2.1, aggregated as 30-year climatological normals from 1994 to 2024. Terrain attributes, including elevation, slope, aspect, and the topographic wetness index, were calculated from the 30-meter Shuttle Radar Topography Mission digital elevation model. Land use and land cover data from the FAO SWALIM regional classification were updated through field verification during the 2024 campaign. All rasters were resampled to a common 30-meter resolution for spatial consistency.
The results reveal a striking spatial pattern. Predicted SOC stocks in the top 30 centimeters ranged from 12.4 to 51.2 megagrams of carbon per hectare, with a mean of 28.6 Mg C ha⁻¹. Stocks were highest in the south and east of the study area, where rainfall reaches 750 millimeters per year, and lowest in the drier north and west. Land use mattered enormously: irrigated agriculture held the highest stocks at 51.2 ± 8.4 Mg C ha⁻¹, followed by forest and woodland at 42.1 ± 9.2, grassland and pasture at 34.9 ± 7.8, and rain-fed agriculture at 28.5 ± 6.9. Bare, degraded land held the lowest stocks at just 14.2 ± 4.3 Mg C ha⁻¹ — and, tellingly, the least variable, suggesting these carbon-poor systems have reached a homogeneous, depleted equilibrium.
The strongest predictors tell a coherent physical story. Clay content correlated with SOC at r = 0.84, reflecting how 2:1 swelling clay minerals physically protect organic matter from microbial decomposition through organo-mineral complexation and reduced microbial access. NDVI, the satellite-derived vegetation index, correlated at r = 0.72, capturing the influence of plant productivity on organic matter inputs. The bare soil index showed a strong negative correlation at r = −0.83, effectively discriminating vegetated, carbon-rich areas from bare, degraded ones. Relative humidity (r = 0.82) and precipitation (r = 0.75) reinforced the moisture-driven pattern, while temperature showed a negative correlation at r = −0.72, consistent with accelerated decomposition in hotter zones.
Model validation was deliberately conservative. Rather than random cross-validation, which would have inflated the apparent accuracy to R² ≈ 0.85, the team used spatial k-fold cross-validation with a 500-meter buffer between training and validation points. This yielded R² = 0.72, RMSE = 8.4 Mg C ha⁻¹ (29 percent of the mean observed stock), and a mean bias of just −0.8 Mg C ha⁻¹. Regression kriging outperformed multiple linear regression by 26 percent in RMSE and ordinary kriging by 9 percent, confirming the advantage of combining regression with geostatistical interpolation of residuals. The kriging standard error ranged from ±2.1 to ±8.4 Mg C ha⁻¹, with 95 percent confidence interval coverage of 91.3 percent — reasonably well-calibrated, though slightly under-covering in areas where legacy data clustered.
The uncertainty map itself is a scientific contribution. Prediction error was lowest in the central clay plain, where decades of legacy sampling and large irrigation schemes provide dense, consistent coverage. It was highest in the sparsely sampled northern and western regions, near the structurally complex Ethiopian escarpment margin, and in transition zones between agricultural and bare land. This spatially explicit uncertainty picture tells decision-makers exactly where additional sampling would most improve the national carbon inventory — a resource that legacy soil databases in Africa, often concentrated in accessible agricultural areas, rarely provide.
For Sudan, the study delivers the first validated SOC stock baseline across the Blue Nile Vertisols, suitable for national greenhouse gas reporting and for targeting soil carbon sequestration interventions. The authors caution that the cross-sectional design — a single 2024 field campaign combined with legacy profiles — cannot causally attribute land-use differences to irrigation or cultivation history; the higher stocks in irrigated agriculture reflect water availability and alluvial inputs rather than tillage effects, which typically accelerate decomposition. Still, the message is clear: in semi-arid Vertisols, water management, not cultivation per se, governs carbon sequestration. As climate change intensifies drought stress across the Sahel, maps like these — showing where carbon lives, where it has vanished, and where it could return — may become as vital to agricultural planning as rainfall forecasts themselves.
Subject of Research: Spatial prediction of soil organic carbon stocks in Sudanese clay soils using regression kriging
Article Title: Spatial prediction of soil organic carbon stocks in Sudanese clay soils using regression kriging
Article References: Jadalla, F. A. H., Oluwasemire, K. O., Elmobarak, A. E. A., & Zein, M. A. M. M. (2026). Spatial prediction of soil organic carbon stocks in Sudanese clay soils using regression kriging. Spanish Journal of Soil Science, 16, Article 16733. https://doi.org/10.3389/sjss.2026.16733
Image Credits: AI Generated
Keywords: soil organic carbon, regression kriging, Sudan, Vertisols, digital soil mapping, Blue Nile, carbon sequestration, semi-arid agriculture, Landsat 9, climate mitigation, Spatial, prediction
Cite Scienmag News
Sloane Callahan. (October 16, 2026). Sudan’s Clay Soils Hold a Hidden Carbon Map — and Satellites Just Drew It. Scienmag. https://scienmag.com/sudans-clay-soils-hold-a-hidden-carbon-map-and-satellites-just-drew-it/
Sloane Callahan. "Sudan’s Clay Soils Hold a Hidden Carbon Map — and Satellites Just Drew It." Scienmag, 16 October 2026, https://scienmag.com/sudans-clay-soils-hold-a-hidden-carbon-map-and-satellites-just-drew-it/. Accessed 16 October 2026.
Sloane Callahan. "Sudan’s Clay Soils Hold a Hidden Carbon Map — and Satellites Just Drew It." Scienmag. October 16, 2026. https://scienmag.com/sudans-clay-soils-hold-a-hidden-carbon-map-and-satellites-just-drew-it/


