


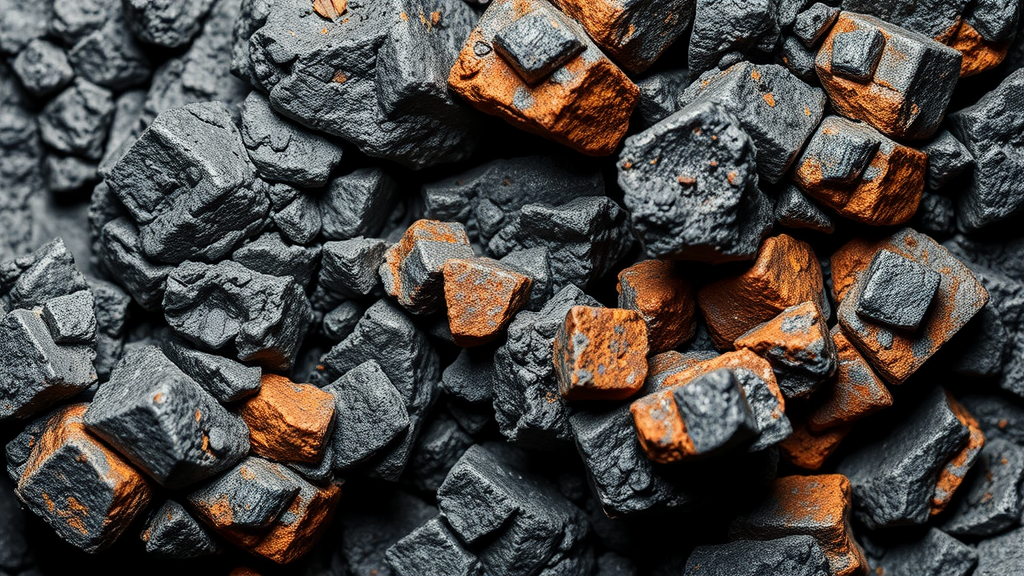
Titanium has quietly become one of the most strategically important metals of the modern era. Lightweight yet remarkably strong, it underpins aerospace engineering, space technology, and defense systems, and demand continues to climb as industries seek high-performance materials. Yet for countries without secure domestic supplies, the metal represents a vulnerability as much as an asset. South Korea, for example, imports roughly 99.8 percent of its titanium alloys, a dependence that has led the government to designate titanium among 33 critical minerals requiring active resource-security management. Against this backdrop, a new laboratory study of one of the country’s most promising titanium deposits offers a data-driven recipe for finding the metal more efficiently beneath the surface.
Researchers led by Bomi Kim of the Korea Institute of Geoscience and Mineral Resources, together with colleagues at Kongju National University, turned their attention to the Myeonsan titanium deposit in the Taebaeksan Basin of eastern South Korea. The deposit, hosted by the Cambrian Myeonsan Formation, is interpreted as a paleo-placer: titanium-bearing minerals such as rutile, ilmenite, and hematite were eroded from Precambrian basement rocks, transported by ancient rivers, and concentrated in conglomeratic sandstone during sedimentary deposition. Because the ore horizons are surrounded by a diverse suite of lithologies, including limestone, clastic sedimentary rocks, intrusive dykes, and granite, the site provides an ideal natural laboratory for testing which physical measurements can reliably separate ore-bearing rock from barren host rock.
The team selected 39 representative drill-core samples from borehole KDMS 2023-10, which penetrates the mineralized interval and its surroundings. The samples were divided into five groups: nine Myeonsan ore specimens, twelve limestones, four dyke rocks, eleven clastic sedimentary rocks, and three granites. Each specimen was prepared as a polished cylinder, a geometry that promotes uniform current distribution and simplifies the calculations needed for electrical measurements. Where core material was scarce, half-core semi-cylindrical specimens were prepared for the titanium ores, ensuring that every sample could pass through the full battery of tests.
That battery was deliberately broad. The researchers measured density and porosity using the Archimedes buoyancy method, following International Society for Rock Mechanics procedures: specimens were dried at 110 degrees Celsius for 24 hours, vacuum-saturated with water, and weighed in both saturated and submerged states. Magnetic susceptibility was recorded with a Bartington MS-3 meter at six positions on each sample to average out mineralogical anisotropy. Direct-current electrical resistivity, time-domain induced polarization (TDIP), and electrochemical impedance spectroscopy (EIS), known in geophysics as spectral induced polarization or SIP, were measured on fully saturated specimens using Solartron instruments with copper-mesh and filter-paper electrodes. Portable X-ray fluorescence (p-XRF) provided elemental compositions, and petrographic thin sections revealed the mineralogical texture behind the numbers.
The results deliver a clear hierarchy of diagnostic power. Density proved the most straightforward discriminator: the titanium ores averaged 3.17 grams per cubic centimeter, well above limestone at 2.74, dyke rocks at 2.73, clastic sediments at 2.84, and granite at 2.68. The elevated density reflects the abundance of heavy oxide minerals such as rutile and ilmenite packed into the ore horizons. The larger standard deviation among ore samples also revealed heterogeneous mineral enrichment within the mineralized interval, a useful warning that ore grades can vary significantly over short distances.
Chargeability, the capacity of a rock to store and slowly release electrical charge, produced an even more dramatic contrast. The ore samples averaged 91.57 millivolts per volt, roughly sixteen times higher than limestone at 5.64, dyke rocks at 3.41, clastic sediments at 4.62, and granite at 6.56. This signal arises because semiconductive ore minerals accumulate charge at mineral-fluid interfaces when an electric current is applied, then release it gradually after the current stops. In practical terms, an induced-polarization survey over this deposit should light up the ore zones while leaving most host rocks nearly invisible, making TDIP one of the most valuable exploration tools for sedimentary titanium deposits.
Not every measurement proved useful, and the negative results are as informative as the positive ones. Porosity values, ranging from 0.36 to 1.19 percent across groups, showed no meaningful separation between ore and host rocks, reflecting instead the compaction and cementation history of the sedimentary sequence. Magnetic susceptibility failed as a discriminator because the ore assemblage itself is magnetically quiet: rutile is only weakly magnetic and hematite is antiferromagnetic, so the intrusive dyke rocks, averaging 10.00 millisiemens per meter, outmagnetized the ores at 2.82. Electrical resistivity was similarly ambiguous, controlled mainly by pore structure and water saturation rather than ore content, with dyke and granite samples showing lower resistivities than the ores themselves.
The frequency-domain measurements added a powerful new dimension. In EIS spectra, several ore specimens, including MO1, MO2, MO5, and MO9, displayed strong phase responses at low frequencies below about 100 hertz, a signature of interfacial polarization between semiconductive ore minerals and pore fluids. These same samples showed the highest TDIP chargeability and elevated titanium contents above 3.11 weight percent and iron above 8.82 weight percent. Other ore samples and most host rocks instead showed phase values that increased toward higher frequencies, a pattern associated with dielectric polarization in insulating silicate and carbonate minerals. The two spectral fingerprints give geophysicists a way to distinguish genuine ore polarization from background dielectric effects, sharpening the interpretation of field survey data.
Petrography tied the physics back to mineralogy. Under the microscope, the ore specimens were dominated by opaque rutile, ilmenite, and hematite with minor quartz, while limestones were composed of calcite, dyke rocks of quartz, feldspar, and amphibole, clastic sediments of alternating coarse and fine silicate grains, and granites of quartz, feldspar, mica, and tourmaline. Sericitization of feldspar in the dykes and granites pointed to hydrothermal alteration. These observations directly explain the measured contrasts: dense, polarizable oxide minerals produce high density, high chargeability, and strong low-frequency phase responses, whereas insulating silicate and carbonate host minerals generate only weak, high-frequency dielectric behavior.
The study also exposed practical limits. One ore specimen, MO3, contained the highest titanium (9.85 weight percent) and iron (24.27 weight percent) of all samples yet showed weaker polarization than its peers, likely because p-XRF was measured at a single spot on a heterogeneous specimen. Because the core samples had to be preserved intact for the mining project, destructive analyses such as X-ray diffraction and ICP-MS were not possible. The authors conclude that spot geochemistry is best used to flag the presence of metallic minerals, while volume-integrating measurements such as density, TDIP, and EIS provide the more robust bulk characterization. Together, the integrated dataset establishes quantitative criteria for distinguishing titanium-bearing rocks from their hosts and demonstrates how combined petrophysical, geochemical, and mineralogical measurements can sharpen the search for a critical mineral whose secure supply increasingly depends on finding it faster and smarter.
Subject of Research: Integrated physical property measurements of titanium-bearing ores and host rocks at the Myeonsan deposit for mineral exploration
Article Title: Integrated physical property measurements of titanium-bearing and host rocks for mineral exploration
Article References: Kim, B., Shin, S., Shin, D., & Lee, G. (2026). Integrated physical property measurements of titanium-bearing and host rocks for mineral exploration. Environmental Earth Sciences, 85(16), Article 405. https://doi.org/10.1007/s12665-026-13140-8
Image Credits: AI Generated
DOI: 10.1007/s12665-026-13140-8
Keywords: titanium, mineral exploration, Myeonsan deposit, induced polarization, spectral induced polarization, density, chargeability, paleo-placer deposit, petrophysics, critical minerals, South Korea, rutile
Cite Scienmag News
Violet Maxwell. (September 20, 2026). Scientists Decode the Physical Fingerprint of Titanium Ores to Supercharge Mineral Exploration. Scienmag. https://scienmag.com/scientists-decode-the-physical-fingerprint-of-titanium-ores-to-supercharge-mineral-exploration/
Violet Maxwell. "Scientists Decode the Physical Fingerprint of Titanium Ores to Supercharge Mineral Exploration." Scienmag, 20 September 2026, https://scienmag.com/scientists-decode-the-physical-fingerprint-of-titanium-ores-to-supercharge-mineral-exploration/. Accessed 5 October 2026.
Violet Maxwell. "Scientists Decode the Physical Fingerprint of Titanium Ores to Supercharge Mineral Exploration." Scienmag. September 20, 2026. https://scienmag.com/scientists-decode-the-physical-fingerprint-of-titanium-ores-to-supercharge-mineral-exploration/


