


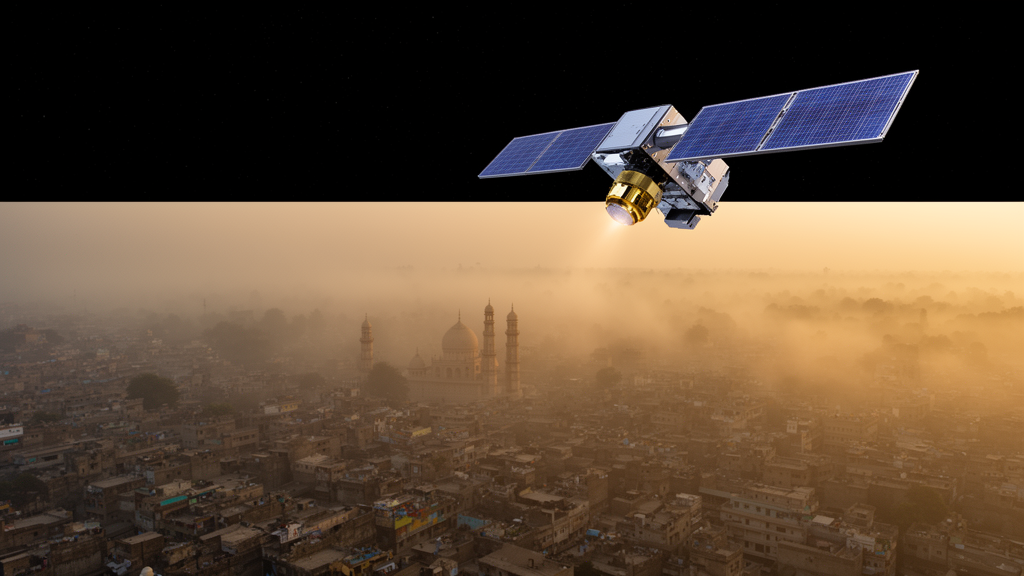
Lahore, Pakistan’s second-largest city and the heart of one of the world’s most polluted airsheds, has long presented a paradox for scientists trying to understand its smog crisis. Pollution varies dramatically from one neighborhood to the next, yet the city has almost no continuous, publicly accessible ground-based monitoring of fine particulate matter, the PM2.5 particles small enough to lodge deep in human lungs. Now, a study published in the journal Air Quality, Atmosphere & Health offers a way around that blind spot. Researchers Muhammad Haseeb and Zainab Tahir of the Institute of Space Science at the University of the Punjab built a framework that fuses data from multiple satellite sensors with machine learning to generate PM2.5 maps at a resolution of 250 meters, a fourfold improvement in spatial detail over the coarsest global datasets currently used to train such models.
The core challenge the researchers confronted is one that plagues air-quality science across much of South Asia and the developing world. Regulatory-grade PM2.5 monitors are expensive, require constant maintenance, and are unevenly distributed, leaving vast urban areas effectively unmeasured. In Lahore, where winter smog regularly pushes concentrations to hazardous extremes, the scarcity of ground observations makes it nearly impossible to know which neighborhoods face the greatest exposure. Global emissions inventories such as the Emissions Database for Global Atmospheric Research, or EDGAR, provide gridded PM2.5 estimates, but only at a resolution of roughly one kilometer, far too coarse to distinguish a dense industrial corridor from a leafy residential district a few hundred meters away.
To sharpen that picture, the team assembled an unusually rich stack of satellite-derived predictors covering the period from 2020 to 2023. From the Copernicus Sentinel-5P mission, they extracted atmospheric concentrations of carbon monoxide, nitrogen dioxide, and sulfur dioxide, along with the ultraviolet aerosol index, a measure of absorbing aerosols in the atmosphere. From NASA’s MODIS instruments they obtained aerosol optical depth, the column measurement of how much light particles remove from the atmosphere. Sentinel-2 imagery contributed vegetation and built-up indices, NDVI and NDBI, which capture the greenness and impervious surface cover of each pixel. They layered in road density, industrial density, and a digital elevation model, then harmonized everything into a unified monthly grid aligned with the EDGAR PM2.5 target.
The machine learning engine at the heart of the framework is XGBoost, a gradient-boosted decision tree algorithm widely favored for tabular geospatial problems because it handles nonlinear interactions between predictors efficiently and resists overfitting through regularization. Trained on the harmonized monthly grid with an 85:15 random train-test split, the model achieved striking internal performance: a coefficient of determination of 0.990 on the held-out test set, with a root mean square error of 3.63 micrograms per cubic meter and a mean absolute error of just 1.50 micrograms per cubic meter. Those numbers describe how well the model reproduces the EDGAR target it was trained on, and they confirm that the satellite predictors carry enough information to reconstruct the pollution field at fine scale.
But the researchers went further, applying a far more demanding validation scheme known as leave-one-month-out testing, in which the model must predict an entire month it has never seen. Under this stricter temporal validation, performance ranged from an R-squared of 0.30 to 0.92 depending on the season. The model generalized best during winter, when Lahore’s characteristic pollution episodes dominate and the relationships between gases, aerosols, and particulate matter are most stable. Performance weakened during transitional months, when the atmospheric chemistry shifts rapidly and the patterns learned from other seasons transfer less reliably. This season-dependence is an honest and important caveat: it shows the model captures the recurring structure of Lahore’s pollution cycle but cannot yet be trusted blindly in every month of the year.
Interpretability analyses revealed which signals actually drive the predictions. Feature-importance rankings and SHAP values, a technique borrowed from cooperative game theory that quantifies each variable’s contribution to individual predictions, identified nitrogen dioxide, carbon monoxide, aerosol optical depth, and the ultraviolet aerosol index as the dominant predictors, with sulfur dioxide and industrial density playing secondary spatial roles. That hierarchy tells a coherent physical story. Nitrogen dioxide and carbon monoxide are tracers of traffic combustion, aerosol optical depth tracks the particulate load itself, and the ultraviolet aerosol index flags absorbing aerosols often associated with smoke and soot. Together with the industrial density layer, the model is effectively learning that Lahore’s smog is built from vehicular emissions, industrial clusters, and the winter temperature inversions that trap everything near the surface.
When the trained model was applied to 2024, the resulting prediction grids reproduced the city’s characteristic seasonal cycle, capturing the intense winter pollution peaks and the cleaner monsoon months. More strikingly, the 250-meter outputs revealed fine-scale spatial contrasts within the city that simply do not exist in the native one-kilometer EDGAR target, distinguishing pollution hotspots at the neighborhood scale where exposure actually happens. For a city where a single monitor must stand in for millions of residents, that kind of spatial texture is precisely what epidemiologists and regulators need to identify which communities bear the heaviest burden.
Validation against real ground data, however, exposed a serious limitation. Comparing predictions with observations from the U.S. Consulate monitoring station in Lahore, the only readily available reference site, the researchers found strong temporal correspondence: a Pearson correlation of 0.874 between EDGAR and ground observations during 2020 to 2023, and 0.889 between the 2024 predictions and ground observations. Yet the framework systematically underestimated absolute concentrations, with mean biases of minus 76.8 and minus 79.8 micrograms per cubic meter respectively. In other words, the model reliably tracks when pollution rises and falls, but its absolute magnitude falls far short of what people on the ground actually breathe. A single-station bias-correction test substantially reduced that magnitude error, but the authors are careful to note that calibrating against just one site means the 250-meter outputs should currently be read as spatially refined relative-pattern estimates rather than fully calibrated neighborhood-level exposure fields.
That distinction matters enormously for how the work should be used. The authors explicitly caution that citywide regulatory applications or health-risk assessments require denser ground-based validation and multi-site calibration before the maps can support policy decisions with confidence. Still, the framework’s architecture is deliberately scalable. Every input dataset is publicly available through the Copernicus and Google Earth Engine catalogs, NASA archives, the EDGAR database, and the U.S. AirNow international program, meaning the same pipeline could be deployed to other cities across the Indo-Gangetic Plain and beyond, wherever monitoring infrastructure lags behind pollution severity.
The broader significance of the study lies in its demonstration that the gap between satellite capability and ground truth can be narrowed with open data and careful validation, even in data-scarce environments. Lahore sits within a region where fine particulate pollution is consistently ranked among the world’s most severe, with documented links to respiratory disease, cardiovascular harm, and cognitive impacts in children. As climate change and rapid urbanization intensify smog episodes across South Asia, tools that can render pollution visible at the scale of streets and schoolyards, while being honest about their limits, may prove essential for the cities fighting to reclaim their air. The Lahore framework is not yet a finished exposure product, but it is a credible blueprint for how the world’s under-monitored megacities can begin to see what they have been breathing.
Subject of Research: Satellite data fusion and machine learning for high-resolution PM2.5 prediction in Lahore, Pakistan
Article Title: Overcoming monitoring gaps: multi-sensor satellite fusion and machine learning for high-resolution PM₂.₅ prediction in Lahore, Pakistan
Article References: Haseeb, M., & Tahir, Z. (2026). Overcoming monitoring gaps: multi-sensor satellite fusion and machine learning for high-resolution PM₂.₅ prediction in Lahore, Pakistan. Air Quality, Atmosphere & Health, 19(10), Article 231. https://doi.org/10.1007/s11869-026-02119-w
Image Credits: AI Generated
DOI: 10.1007/s11869-026-02119-w
Keywords: PM2.5, air quality, Lahore, machine learning, XGBoost, Sentinel-5P, MODIS AOD, remote sensing, urban pollution, EDGAR, SHAP, Pakistan
Cite Scienmag News
Teresa Odom. (October 9, 2026). Satellites and Machine Learning Map Lahore’s Toxic Air at Unprecedented 250-Meter Detail. Scienmag. https://scienmag.com/satellites-and-machine-learning-map-lahores-toxic-air-at-unprecedented-250-meter-detail/
Teresa Odom. "Satellites and Machine Learning Map Lahore’s Toxic Air at Unprecedented 250-Meter Detail." Scienmag, 9 October 2026, https://scienmag.com/satellites-and-machine-learning-map-lahores-toxic-air-at-unprecedented-250-meter-detail/. Accessed 9 October 2026.
Teresa Odom. "Satellites and Machine Learning Map Lahore’s Toxic Air at Unprecedented 250-Meter Detail." Scienmag. October 9, 2026. https://scienmag.com/satellites-and-machine-learning-map-lahores-toxic-air-at-unprecedented-250-meter-detail/


