


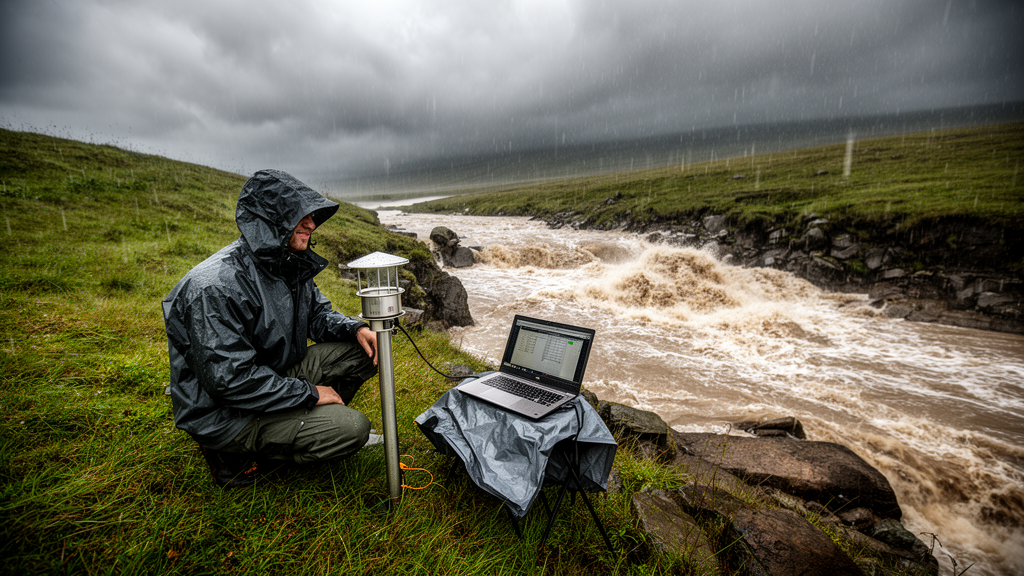
Every bridge, storm sewer, and retention basin in the modern world is quietly built around a statistical guess: how much rain will fall in a storm so rare that it may occur only once in a hundred years? Engineers answer that question with intensity-duration-frequency curves, the workhorses of flood-risk design that link rainfall intensity to storm duration and return period. The trouble is that these curves are usually estimated from observational records that are far too short, often just a few decades, and the resulting uncertainty can be enormous. A new study published in the journal Advances in Statistical Climatology, Meteorology and Oceanography has now put six competing statistical models through an unprecedented stress test, using two thousand years of simulated climate data as a benchmark, and found a clear winner that could halve the errors in today’s flood-design estimates.
The research, led by Alexander Lee Rischmuller of the Research Unit Sustainability and Climate Risk at Universität Hamburg, together with Benjamin Poschlod and Jana Sillmann, focuses on southern Germany, a region whose complex topography makes it a demanding proving ground for rainfall statistics. The team drew on the Canadian Regional Climate Model Large Ensemble, known as CRCM5-LE, a fifty-member set of regional climate simulations dynamically downscaled to a resolution of roughly 12.5 kilometres. Because each of the fifty members differs only by tiny perturbations in its initial conditions, the spread among them represents the chaotic internal variability of the climate system itself. Stacking all fifty realizations for the period 1980 to 2019 yields a homogeneous, gap-free sample of two thousand simulated years, an archive of extreme rainfall that no real weather station could ever hope to match.
That archive served as what statisticians call a perfect model experiment. Rather than asking whether the climate model perfectly reproduces reality, the researchers treated the full two-thousand-year ensemble as the ground truth. From it they computed what they term effective return levels, for example the hundred-year rainfall intensity represented by the twentieth-highest annual maximum in the entire sample. They then carved the archive into artificial sub-samples of thirty to one hundred years, mimicking the typical length of observational records for sub-daily rainfall, and asked each candidate model to reproduce the true hundred-year return level from these fragments. Each sub-sample size was drawn one hundred times, generating a rigorous test of accuracy and robustness across twenty-five grid cells and six rainfall durations ranging from one to forty-eight hours.
The statistical backbone of the exercise is the Generalized Extreme Value distribution, the canonical tool of extreme value theory. When rainfall maxima are sampled in blocks, typically annual maxima, their distribution converges to the GEV, which is described by three parameters: location, scale, and shape. The shape parameter is the critical one, because it governs the behaviour of the distribution’s tail and therefore the estimated magnitude of rare events. Small errors in the shape parameter can dramatically distort estimates of the hundred-year return level, and the problem worsens as sample sizes shrink. The study’s central innovation lies in how the shape parameter is handled within a duration-dependent GEV model, which pools data across all durations into a single coherent framework rather than fitting each duration separately and risking physically inconsistent curves.
The six models tested spanned the full spectrum of current practice. Two frequentist approaches, a standard GEV fitted by L-moments and a duration-dependent GEV fitted by maximum likelihood, represented the state of the art. Three Bayesian hierarchical variants of the duration-dependent GEV followed, differing in whether the shape parameter was allowed to vary across durations, across space, or across both. A fourth, non-hierarchical Bayesian model completed the set. Hierarchical models share information across dimensions through hyperpriors, a mechanism known as partial pooling that shrinks individual estimates toward a common mean and stabilizes inference when data are sparse. All Bayesian models were fitted with the No-U-Turn sampler, an efficient form of Hamiltonian Monte Carlo implemented in the Stan framework.
The verdict was unambiguous. The hierarchical model with a shape parameter that varies with rainfall duration but remains fixed across space, abbreviated dGEV-BHM-ξ(d), delivered the highest accuracy and the narrowest confidence intervals across nearly every test. When fitted to a thirty-year sample, the typical situation for sub-daily rainfall records in Germany, it cut the relative error of the hundred-year return level to 8.8 percent, compared with 18.1 percent for the standard L-moments GEV. Its return level concordance, the fraction of modelled hundred-year estimates falling within the confidence interval of the true ensemble value, reached 27 to 35 percent, roughly ten percentage points above every competitor. The most flexible model, which let the shape parameter vary over both space and duration, performed worst, because its extra complexity could not be supported by samples of one hundred years or fewer.
The physical insight behind the winning configuration is telling. The fitted shape parameters revealed heavier tails for short convective bursts, with values around 0.15 to 0.2 for one- to three-hour storms, declining to roughly 0.06 for forty-eight-hour events. This duration dependence matches earlier global surveys of rainfall tails, while the spatial constancy of the shape parameter within a small region echoes previous findings that neighbouring sites share similar tail behaviour. By fixing the shape parameter across space, the model reduces the number of free parameters, suppresses overfitting, and shields the tail estimate from unlucky sub-samples dominated by internal climate variability. The resulting intensity-duration-frequency curves, demonstrated for a locality near Würzburg, reproduced the true hundred-year return levels across all durations, whereas the maximum-likelihood benchmark overestimated rainfall for durations of six hours and longer.
Perhaps the most consequential finding, however, concerns a diagnostic tool that practitioners rely on routinely: the Anderson-Darling goodness-of-fit test. Across 720,000 hypothesis tests, the researchers found that the test’s verdicts aligned with model flexibility rather than predictive skill. The most flexible models passed the test most often, while the best-performing hierarchical model was rejected most frequently. The reason is a classic bias-variance trade-off. A flexible model can overfit the quirks of a small sample, earning a passing grade on the fit test while generalizing poorly to the rare quantiles that actually matter for risk assessment. A model that passes an Anderson-Darling test on a thirty-year record, the authors conclude, is not necessarily capable of predicting very rare probabilities of occurrence. For climate-risk applications, the Akaike information criterion proved far better aligned with true predictive skill.
The implications reach well beyond southern Germany. Because the recommended model requires only sub-daily precipitation data from several stations with similar characteristics, it is directly applicable to the short, sparse records that dominate observational hydrology, and to high-resolution climate simulations that typically cover only a few decades. The framework could sharpen the rainfall return levels used to design stormwater systems, inform catastrophe models, and support adaptation planning in a warming climate where extreme rainfall is intensifying. The authors acknowledge limitations: the models assume stationarity, which is reasonable for the 1980 to 2019 window they examined but would need non-stationary extensions for climate projections, and the spatially constant shape parameter restricts the approach to relatively homogeneous regions, though clustered applications or covariate-based extensions could widen its reach. Bayesian computation is also more demanding than L-moments. Yet as floods grow more severe and design standards come under scrutiny, the study makes a compelling case that borrowing strength across space and duration, rather than squeezing every drop of flexibility from scarce data, is the more reliable path to knowing how hard the rain of the next century will fall.
Subject of Research: Statistical estimation of extreme precipitation intensity-duration-frequency curves using Bayesian hierarchical models and a large climate model ensemble
Article Title: Bayesian hierarchical modelling of intensity-duration-frequency curves using a climate model large ensemble
Article References: Rischmuller, A. L., Poschlod, B., & Sillmann, J. (2026). Bayesian hierarchical modelling of intensity-duration-frequency curves using a climate model large ensemble. Advances in Statistical Climatology, Meteorology and Oceanography, 12(1), 1-19. https://doi.org/10.5194/ascmo-12-1-2026
Image Credits: AI Generated
Keywords: extreme precipitation, intensity-duration-frequency curves, Generalized Extreme Value distribution, Bayesian hierarchical model, climate model large ensemble, return levels, flood risk, shape parameter, Anderson-Darling test, southern Germany, internal climate variability, extreme value theory
Cite Scienmag News
Sloane Callahan. (October 9, 2026). Two Thousand Years of Simulated Rainfall Reveal a Better Way to Predict Extreme Floods. Scienmag. https://scienmag.com/two-thousand-years-of-simulated-rainfall-reveal-a-better-way-to-predict-extreme-floods/
Sloane Callahan. "Two Thousand Years of Simulated Rainfall Reveal a Better Way to Predict Extreme Floods." Scienmag, 9 October 2026, https://scienmag.com/two-thousand-years-of-simulated-rainfall-reveal-a-better-way-to-predict-extreme-floods/. Accessed 9 October 2026.
Sloane Callahan. "Two Thousand Years of Simulated Rainfall Reveal a Better Way to Predict Extreme Floods." Scienmag. October 9, 2026. https://scienmag.com/two-thousand-years-of-simulated-rainfall-reveal-a-better-way-to-predict-extreme-floods/


