

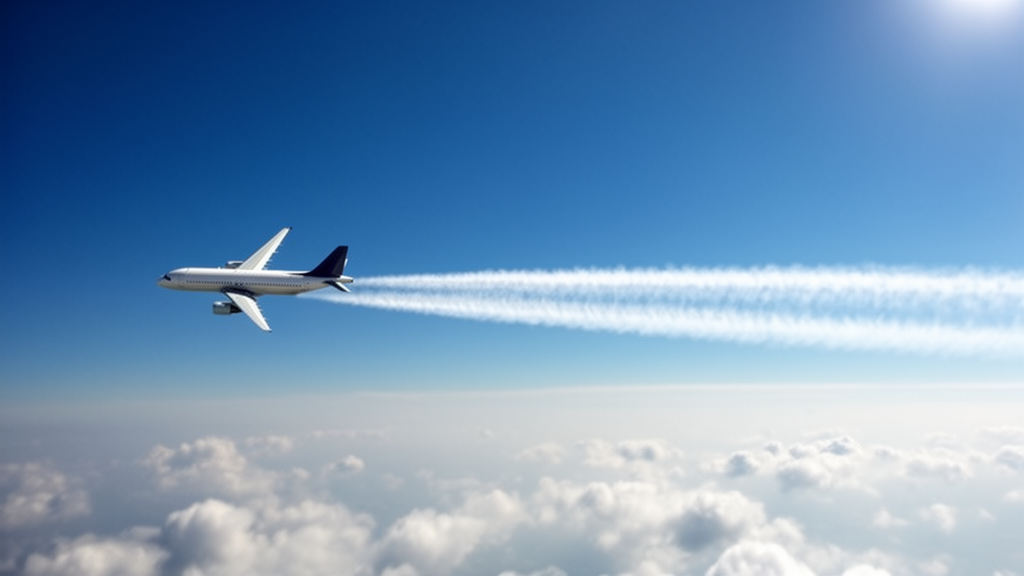
Researchers from Delft University of Technology, Contrails.org, and Forschungszentrum Jülich have demonstrated that high-resolution satellite imagery can accurately track the formation and early evolution of aircraft contrails. By locating specific research aircraft within images from low Earth orbit satellites, the team created a dataset of 543 flights to evaluate how well thermodynamic models predict the creation of these linear clouds. The study, published in Atmospheric Measurement Techniques, provides a new observational benchmark for assessing the climate impact of aviation, a sector where contrails are estimated to contribute over half of the total radiative forcing.
Contrails form when hot engine exhaust mixes with cold, dry air in the upper troposphere, causing water vapor to condense and freeze. While most dissipate within minutes, some persist for hours and spread into cirrus-like clouds that trap outgoing terrestrial radiation. This net warming effect has an estimated effective radiative forcing of 57.4 mW m−2 for the year 2018, although the 90% confidence interval ranges from 17 to 98 mW m−2. Mitigating this impact through aircraft rerouting requires skillful predictions of where and when contrails will form, a task complicated by uncertainties in meteorological data and observational limitations.
The primary challenge in validating contrail models is the uncertainty in the input data required for predictions. Numerical weather prediction data, such as relative humidity, are often unreliable in the upper troposphere, making it difficult to distinguish between model errors and input data errors. Additionally, traditional geostationary satellite images have a coarse spatial resolution of 1 to 2 km, which prevents the observation of young contrails during their initial jet and vortex phases. To address these issues, the study utilized high-resolution imagery from the Sentinel-2 and Landsat missions, which offer spatial resolutions of 10 to 30 meters.
The research team employed the In-service Aircraft for a Global Observing System (IAGOS) fleet, which carries in situ humidity and temperature sensors. By collocating the positions of these aircraft with satellite imagery, the researchers could compare direct atmospheric measurements with visual observations of contrail formation. The dataset covers flights from 2013 to 2022, with the majority of observations occurring from 2017 onward. The aircraft were found in climb, cruise, and descent phases, with a mean geometric altitude of 10.5 km and 90% of collocations occurring above 9.0 km.
To evaluate the Schmidt–Appleman criterion (SAC), a thermodynamic model used to predict contrail formation, the team compared model predictions against the satellite observations. When using the in situ temperature and humidity measurements from the IAGOS aircraft, the SAC correctly explained 98.3% of the observations, accounting for measurement uncertainty. This high level of agreement suggests that the SAC is a robust predictor of contrail formation when provided with accurate local meteorological data. In contrast, when using meteorological data from the ERA5 reanalysis, the agreement dropped to 92.1%, highlighting the sensitivity of the model to input data quality.
The study also examined the impact of satellite resolution on observation quality. Observations from the Landsat satellites, which have a 30-meter resolution, showed lower precision in SAC predictions compared to the 10-meter resolution of Sentinel-2. This difference is attributed to the coarser resolution of Landsat imagery, which can miss thinner contrails during the early jet phase when vortex widths are only in the tens of meters. The precision for Sentinel-2 observations was found to be statistically significantly higher than that for Landsat, with a p-value of 5% for the difference in precision.
For the 195 contrails annotated in the Sentinel-2 imagery, the researchers analyzed their lifetimes and growth patterns. They found that 48.2% of the contrails persisted for longer than 10 seconds, which corresponds to the duration of the jet phase, while 8.7% lasted longer than 120 seconds, marking the end of the vortex phase. The relative humidity with respect to ice (RHi) was found to correlate strongly with contrail lifetime, exhibiting an R-squared value of 0.49 with the logarithm of contrail age. Contrails that survived beyond the vortex phase had a mean RHi of 0.96, indicating that they can persist in slightly ice-subsaturated air.
The horizontal growth of the contrails during the jet and vortex phases was also analyzed. The observed widths were consistent with previous observations and model simulations, showing rapid initial growth during the jet phase followed by a period of stagnation during the vortex phase. The initial width in the jet phase was approximately 50 meters, comparable to the initial wake vortex separation. During the vortex phase, the width remained relatively constant between 80 and 100 meters. These observations provide valuable constraints for contrail evolution models, particularly for the early stages of contrail development that are often missed by lower-resolution instruments.
Despite the high agreement between the SAC and observations, the study notes several limitations. The dataset consists of only 10 different aircraft, all from two wide-body families with three engine types, which may limit the generalizability of the results to modern lean-burn or high-bypass engines. Additionally, the manual annotation of contrails introduces potential biases in the derived widths, particularly for older, more diffuse contrails. The limited number of contrails that persisted into the dispersion phase prevented robust statistical conclusions on horizontal growth rates in that regime, although three case studies illustrated the comparison with model predictions.
The findings underscore the importance of high-resolution LEO satellites in creating observational datasets for evaluating and improving contrail models. By combining in situ measurements with high-resolution imagery, the study reduces the uncertainty associated with meteorological inputs and observational constraints. This approach provides a more accurate assessment of model performance, which is essential for developing effective mitigation strategies to reduce the climate impact of aviation. The methodology presented could be extended to a larger dataset covering a wider range of atmospheric conditions and aircraft types to further validate contrail evolution models.
The Schmidt–Appleman criterion, the thermodynamic model evaluated in this study, operates by modeling the mixing of engine exhaust with ambient air as an isobaric process. In this framework, contrail formation is predicted when the exhaust plume becomes supersaturated with respect to liquid water during the mixing process. The model calculates a mixing line on a chart of temperature versus water vapor partial pressure, connecting the ambient air state with the engine exhaust state. If this line crosses above the saturation pressure curve for liquid water, the criterion is satisfied. The study quantified how close specific ambient conditions were to this threshold by calculating a temperature difference, denoted as ΔTLC. When this value is negative, the SAC predicts that contrails will form. The accuracy of this prediction depends heavily on the quality of the input data, particularly the overall propulsion efficiency of the aircraft, which was estimated using the Poll–Schumann model with an uncertainty of 15%.
Previous evaluations of the SAC using ground-based camera observations have reported lower levels of agreement between model predictions and actual contrail formation. For instance, a study by Low et al. (2025) found that SAC predictions based on numerical weather prediction data correctly predicted contrail formation in only 75.8% of cases. Another recent ground-based study by Jarry et al. (2026) reported even lower precision. The authors of the current study suggest that these discrepancies may arise from the spatial resolution of ground-based instruments or the presence of low-level clouds and sun glare, which can complicate visual detection. In contrast, the high-resolution LEO satellite imagery used in this study allows for the detection of contrails at the moment of formation, providing a clearer benchmark for model validation without the observational ambiguities inherent in ground-based methods.
The collocation process used to locate aircraft in satellite imagery required specific corrections to account for geometric distortions. Because the satellite images are orthorectified to the Earth’s surface, objects located at high altitudes, such as aircraft, experience a parallax displacement that can shift their apparent position by one to two kilometers. Additionally, the scanning time of individual pixels varies across the image due to the staggered architecture of the satellite sensors. The researchers developed an algorithm to correct for these effects, improving the accuracy of the aircraft position estimates. After applying these corrections, the position of 95% of the aircraft was estimated to within 487 meters, a significant improvement over the 3.06 kilometers achieved without corrections. This precision was essential for linking specific atmospheric measurements to the visual presence or absence of a contrail.
The IAGOS humidity sensors used in this study have specific limitations in the upper troposphere and lower stratosphere. The capacitive hygrometer has a lower detection limit for water vapor between 10 and 30 parts per million by volume, which can affect measurements in very dry air masses. Furthermore, the sensor has a temperature-dependent response time, ranging from 1 second at 300 Kelvin to 120 seconds at 210 Kelvin. This slow response can dampen sharp humidity gradients, meaning the measured relative humidity may not accurately represent the actual atmospheric conditions at the exact moment of measurement. The researchers noted that while these factors could introduce errors, the primary driver of the SAC prediction is the air temperature, which is measured with a much higher precision of 0.5 Kelvin. Therefore, the humidity sensor’s limitations are not expected to strongly affect the overall results of the contrail formation evaluation.
The study also compared the observed contrail widths with predictions from the Contrail Cirrus Prediction (CoCiP) model. CoCiP is a Lagrangian Gaussian plume model that simulates the full life-cycle of a contrail, including its dispersion phase. The model predicts an initial width at the end of the vortex phase of approximately 20 meters for the aircraft types in the IAGOS fleet. However, the observed widths in the satellite imagery were found to be a factor of 2 to 4 higher than these model calculations. The authors note that the initial width has a relatively small impact on the subsequent evolution of the contrail within the dispersion phase, as the initial depth is more important for determining the rate of horizontal growth driven by vertical wind shear. The observed horizontal growth rates for the three oldest contrails in the dataset, which persisted for more than 10 minutes, were approximately 102, 56, and 49 meters per minute, aligning with previous ground-based LIDAR observations.
Subject of Research: Validation of contrail formation models using high-resolution satellite imagery and in situ aircraft measurements
Article Title: Observing formation and early evolution of contrails formed by IAGOS aircraft using high-resolution LEO satellite imagery
Article References: Woldhuis, T., Engberg, Z., Rohs, S., & Meijer, V. (2026). Observing formation and early evolution of contrails formed by IAGOS aircraft using high-resolution LEO satellite imagery. Atmospheric Measurement Techniques, 19(21), 6891-6920. https://doi.org/10.5194/amt-19-6891-2026
Image Credits: AI Generated
Keywords: contrails, satellite imagery, aviation climate impact, IAGOS, Schmidt-Appleman criterion, low Earth orbit, atmospheric measurement, radiative forcing, Observing, formation, early, evolution
Cite Scienmag News
Russell Cooper. (November 8, 2026). Satellite Images Validate Contrail Formation Models. Scienmag. https://scienmag.com/satellite-images-validate-contrail-formation-models/
Russell Cooper. "Satellite Images Validate Contrail Formation Models." Scienmag, 8 November 2026, https://scienmag.com/satellite-images-validate-contrail-formation-models/. Accessed 8 November 2026.
Russell Cooper. "Satellite Images Validate Contrail Formation Models." Scienmag. November 8, 2026. https://scienmag.com/satellite-images-validate-contrail-formation-models/