


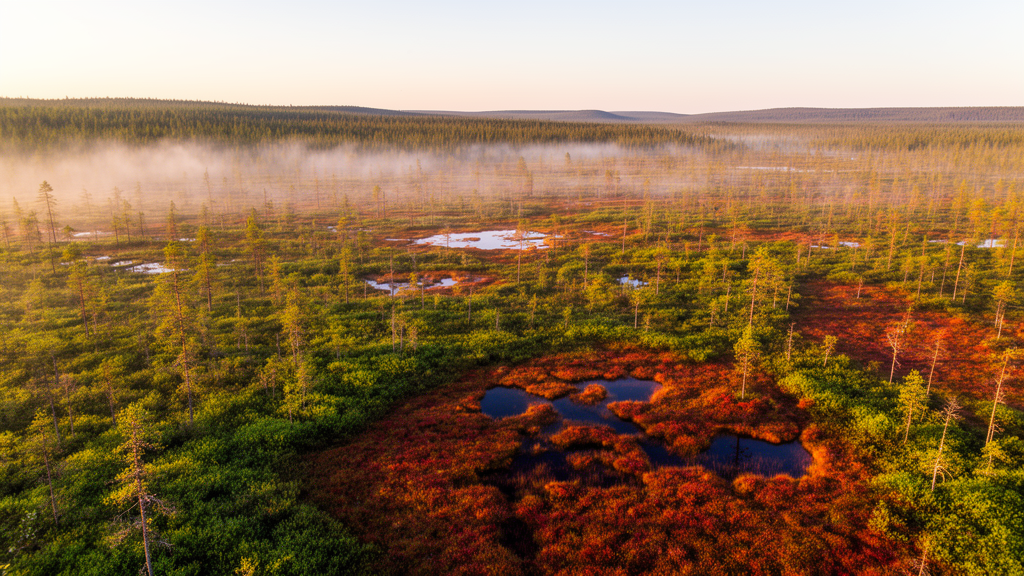
Northern peatlands have quietly banked carbon for thousands of years, cooling the planet by an estimated 0.6 degrees Celsius over the Holocene. Now, a new satellite analysis suggests that the vegetation crowning these carbon vaults is changing in ways that are far more complicated than a simple story of warming-driven greening. Using 23 years of satellite data, researchers have produced the first multi-decadal assessment of canopy change based strictly on mapped peatlands rather than the broader Arctic and boreal domains in which peatlands are usually embedded, and the results upend the assumption that the North is uniformly turning greener.
The study, published in Biogeosciences by Iuliia Burdun of Aalto University and KU Leuven, Jiabin Pu and Ranga B. Myneni of Boston University, and corresponding author Miina Rautiainen of Aalto University, tracked leaf area index (LAI) across peatland-dominated pixels north of 45 degrees North from 2001 to 2023. LAI is an Essential Climate Variable that describes the amount of green foliage above the ground, defined as one half of the total green leaf area per unit of horizontal ground surface. In simple terms, higher LAI means more green leaf area, and the team interpreted increases over time as greening and decreases as browning.
What makes the analysis technically distinctive is the data record itself. The researchers used a gap-filled, sensor-independent LAI climate data record at 500-meter resolution, which merges high-quality retrievals from MODIS Terra, MODIS Aqua, and VIIRS for each eight-day period. This sensor-independence reduces biases tied to any single satellite’s calibration and overpass time, while a spatio-temporal tensor completion model fills gaps left by clouds, aerosols, and snow. The result is a consistently processed, uncertainty-quantified time series stable enough for climate-scale analysis, a critical requirement when the goal is to detect subtle, multi-decadal canopy change.
The peatland mask was built conservatively by integrating four complementary global datasets: PEATMAP, OpenStreetMap wetland polygons, ESA WorldCover herbaceous wetlands, and the Global Peatland Map 2.0. Areas were retained only when supported by at least two of the three wetland-mapping sources and located within the Global Peatland Map 2.0, yielding roughly 535,017 square kilometers of conservatively mapped peatland. The team then kept only 500-meter pixels with at least 90 percent mapped peatland cover and excluded any pixel classified as burned between 2001 and 2023 in the MCD64A1 fire dataset, leaving 1,244,063 pixels capturing more than half of the conservative peatland mask. This pixel selection was designed to minimize mixed-pixel effects from adjacent forests, open water, and farmland, and to avoid confounding by abrupt fire disturbance and post-fire recovery.
The headline numbers are striking. More than 77 percent of the studied peatland area, about 203,269 of roughly 261,819 square kilometers, showed positive LAI trends, corresponding to a greening-to-browning ratio of 3.5:1. The strongest greening clustered in southern West Siberia, Central Europe, and southern Fennoscandia, while the largest browning pattern appeared near the Hudson Bay Lowlands in North America. Across the distribution, decadal LAI trends ranged from -1.07 to 0.78 square meters per square meter per decade, with 95 percent of values between -0.07 and 0.09. Yet here is the twist: when the researchers accounted for spatial autocorrelation across the map using a partitioned spatial generalised least squares framework, the area-weighted LAI trend at the map scale was statistically indistinguishable from zero. Widespread local greening did not add up to a significant overall increase in greenness.
The climate associations were equally counterintuitive. LAI anomalies showed a weak but predominantly positive partial correlation with air temperature anomalies and a weak, predominantly negative partial correlation with precipitation anomalies, with the strongest associations in West Siberia and the Hudson Bay Lowlands. In the best-fitting model of long-term LAI trends, multi-year mean annual precipitation, rather than air temperature, was retained. The authors argue that this negative LAI-precipitation relationship aligns with peatland hydrology: reduced precipitation lowers the water table and dries peatlands, favouring the expansion of dry-habitat vascular plants at the expense of Sphagnum mosses, the ecosystem engineers that maintain the acidic, waterlogged conditions under which peat accumulates. Greening in northern peatlands may therefore reflect vascular plant expansion rather than enhanced moss growth, a shift with potential consequences for peat-forming function and carbon sequestration.
Perhaps the most intriguing finding involves the Pacific Decadal Oscillation, a pattern of Pacific climate variability that modulates temperature and precipitation north of 40 degrees North. Most peatland pixels followed a linear LAI trend with no detected breakpoint, but where non-linear trends occurred, their breakpoints were often temporally aligned with phase shifts in the PDO. Cup-shaped trends, in which LAI first declined and then increased, were concentrated in West Siberia, with breakpoints peaking during 2005-2010. Hat-shaped trends, in which LAI first rose and then fell, were widespread across Europe, northeastern Asia, and Canada, with a later breakpoint density peak during 2012-2016. In both non-linear classes, peaks in breakpoint density occurred soon after a PDO phase change, the first observation, to the authors’ knowledge, that a PDO shift might contribute to changes in peatland vegetation trends.
Tree cover also shaped the trajectories. Greater tree cover was associated with less greening, but the effect was numerically small and varied by continent, canopy type, and precipitation regime. In Asian peatlands where the nearest surrounding trees in 2001 were evergreen needleleaf, each additional 1 percent of tree cover was associated with a mean decline of 1.06 x 10^-4 square meters per square meter per decade, and the penalty was markedly steeper in North America. Deciduous needleleaf cover, such as larch, attenuated the negative tree-cover effect, consistent with field studies showing that larch mitigates the negative association between tree mortality and greening. Higher multi-year mean annual precipitation moderated the negative slope, making it less negative in sufficiently wet sites. Counterintuitively, the largest positive LAI trends in North America occurred at high tree-cover levels, a pattern that can arise when partial conifer mortality and understory release increase vascular leaf area despite high initial canopy cover.
Permafrost thaw added another pathway of decadal non-linearity. Frozen ground acts as a hydrological dam, and thermokarst-lake drainage breaches it, reconfiguring drainage pathways and triggering land cover transitions. Pixels overlapping mapped drained lakes showed a higher prevalence of increasing LAI trends, with 94.5 percent of the 2,328 overlapping pixels trending upward, predominantly in Asian peatlands. The relative share of drained-lake overlap was highest for cup-shaped increasing trends, compatible with a vegetation shift in which initial permafrost disturbance is followed by graminoid and shrub colonisation and, locally, tree establishment after two to three decades. Because moderate-resolution LAI integrates heterogeneous peatland-lake mosaics, part of the apparent increase may reflect a decline in the open-water fraction rather than canopy change alone, and the authors caution that this exploratory pattern should not be generalised.
Protection status, notably, did not explain LAI trends once differences in climate and canopy were accounted for. About 11 percent of the studied pixels fell within protected areas, mirroring global estimates that only about 17 percent of peatlands are protected. The authors stress that a null association should not be read as evidence that protection is ineffective; benefits may occur in attributes not captured by LAI, such as biodiversity, or at magnitudes below detectability given limited protected-area coverage. Taken together, the findings suggest that recent peatland canopy change was not a uniform increase in greenness but a moisture-sensitive, tree-composition-dependent response modulated by decadal climate variability. As northern Eurasia grows more arid and Arctic heatwaves expand, the authors argue that future work should link observed LAI trends with peatland-specific land-surface models to detect moisture-driven regime shifts at the circumpolar scale, and that climate-aware management, rather than legal designation alone, will be essential for conserving these carbon-rich ecosystems.
Subject of Research: Biogeosciences
Article Title: Detecting long-term canopy change and vegetation shifts in northern peatlands using LAI and climate data
Article References: Burdun, I., Pu, J., Myneni, R. B., & Rautiainen, M. (2026). Detecting long-term canopy change and vegetation shifts in northern peatlands using LAI and climate data. Biogeosciences, 23(20), 7289-7308. https://doi.org/10.5194/bg-23-7289-2026
Image Credits: AI Generated
Keywords: peatlands, LAI, remote sensing, climate change, Pacific Decadal Oscillation, carbon storage, permafrost, Biogeosciences, Detecting, long-term, canopy, change
Cite Scienmag News
Drew Townsend. (October 19, 2026). Northern Peatlands Are Greening Unevenly as Warming Reshapes Their Canopies. Scienmag. https://scienmag.com/northern-peatlands-are-greening-unevenly-as-warming-reshapes-their-canopies/
Drew Townsend. "Northern Peatlands Are Greening Unevenly as Warming Reshapes Their Canopies." Scienmag, 19 October 2026, https://scienmag.com/northern-peatlands-are-greening-unevenly-as-warming-reshapes-their-canopies/. Accessed 19 October 2026.
Drew Townsend. "Northern Peatlands Are Greening Unevenly as Warming Reshapes Their Canopies." Scienmag. October 19, 2026. https://scienmag.com/northern-peatlands-are-greening-unevenly-as-warming-reshapes-their-canopies/


