


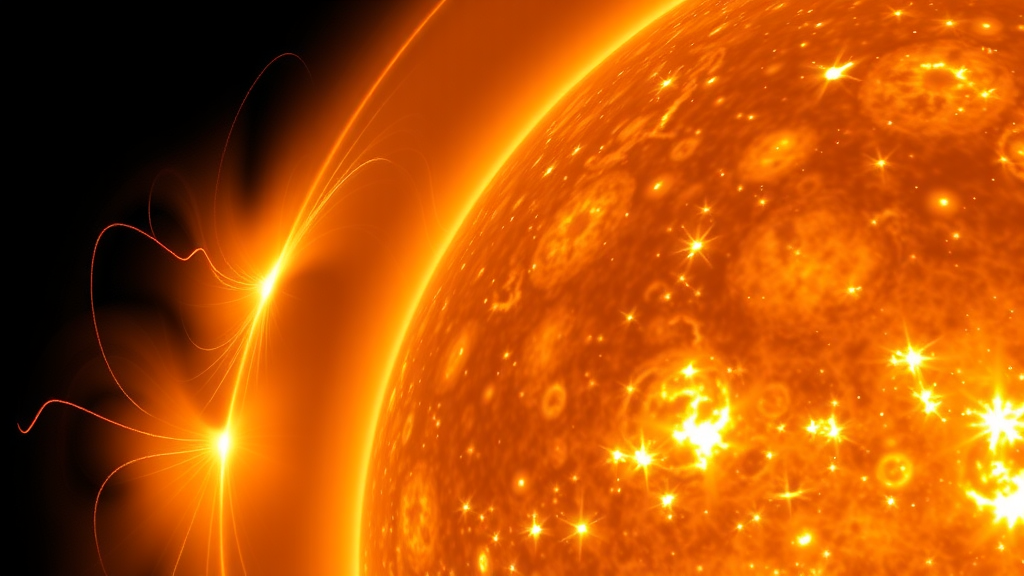
NASA’s Solar Dynamics Observatory has been staring at the Sun for more than fifteen years, and its instruments continue to yield surprises. In a new study published in the journal Solar Physics, a team at the Laboratory for Atmospheric and Space Physics in Boulder, Colorado, led by Thomas N. Woods, introduces the EVE Level 4 Lines data product, a new resource that extracts wavelength shifts from extreme ultraviolet solar spectra and converts them into Doppler velocities. The result is a fresh window on the violent choreography of plasma inside solar flares, revealing downflows in the Sun’s lower atmosphere and upflows in its corona that peak during a flare’s most explosive moments.
The Extreme-ultraviolet Variability Experiment, or EVE, was never designed to measure Doppler velocities. Its mission is to track how the Sun’s extreme ultraviolet output varies over time, information that matters because that radiation is the primary energy input to Earth’s ionosphere and thermosphere. EVE observes the full solar disk from 6 to 106 nanometers with a spectral resolution of just 0.1 nanometers, using its Multiple EUV Grating Spectrographs, known as MEGS. At that modest resolution, detecting the tiny wavelength shifts produced by moving plasma would seem impossible. Yet two fortunate circumstances changed the calculus: the SDO spacecraft holds its solar pointing with exceptional stability, and its geosynchronous orbit provides an unusually stable thermal environment, keeping the instrument’s wavelength scale steady enough to capture genuine solar motions.
The new data product fits Gaussian profiles to 70 carefully selected emission features, each originating from a distinct layer of the solar atmosphere. Roughly half of the lines come from the transition region, a thin boundary layer where temperatures climb from about 25,000 kelvin to 0.6 million kelvin, and half come from the corona above, where temperatures exceed 0.6 million kelvin and can surpass 6 million kelvin during flares. The fitting algorithm models each feature of interest with a Gaussian plus two additional Gaussians for blended neighboring lines and a linear background, yielding fitted values for intensity, wavelength center, and line width. When the GOES X-Ray Sensor detects a flare, the algorithm automatically subtracts a pre-flare spectrum to isolate the flare’s own spectral signature, flagging those events in the data product.
Converting wavelength shifts to velocities is straightforward in principle: the shift between the flare spectrum and the pre-flare spectrum, multiplied by the speed of light and divided by the reference wavelength, gives the line-of-sight velocity. Positive values are red shifts, indicating plasma receding from the observer, which for flares near disk center means downflow. Negative values are blue shifts, indicating approaching plasma, or upflow. The team emphasizes that measured pre-flare wavelengths, rather than theoretical values from the CHIANTI spectral database, must serve as the reference, because small systematic offsets in the instrument’s wavelength scale would otherwise contaminate the result.
Not every spectral line is trustworthy for this work. Many EUV features are blends of multiple emissions at MEGS resolution, and different lines dominate at different plasma temperatures, so a blended feature can shift spuriously as solar activity changes. The team used CHIANTI model spectra for quiet Sun, active region, and flare conditions to estimate this blend uncertainty for each of the 70 features, expressing it as a velocity error. Forty-two lines, nine from MEGS-A and thirty-three from MEGS-B, came in below the 30 kilometers-per-second threshold and are flagged as the best choices for studying flare dynamics. The rest carry blend errors large enough to swamp any genuine solar signal.
Perhaps the most technically demanding part of the study involved disentangling an optical artifact from real solar physics. The MEGS-B instrument uses two Rowland-circle spectrographs in tandem, and because its CCD sensor is flat rather than curved along the Rowland circle, most wavelengths are slightly out of focus. That defocus makes the measured wavelength scale sensitive to where an active region sits on the solar disk. Raytrace modeling of the original optical design confirmed that active regions near the east limb produce wavelength shifts in one direction, west-limb regions in the opposite direction, with the sign flipping between central and outer wavelengths. Earlier reports of surprisingly fast prograde-rotation velocities of about 50 kilometers per second in coronal lines, published by Hudson and colleagues in 2022, turn out to be an artifact of this optical behavior rather than a genuine solar flow.
To validate and calibrate the correction, the team exploited a rare window in April 2019 near the minimum of solar cycle 24, when a single active region, NOAA 12738, crossed the disk alone over six days. By subtracting a spectrum from a spotless day to remove the full-disk contribution, and then fitting the remaining active-region spectrum, the researchers measured wavelength shifts that matched a tuned raytrace model remarkably well. The tuning revealed that the Sun’s center sits about 2.5 arc-minutes east of MEGS-B’s optical center, a misalignment inherited from the compromise positioning of EVE’s three channels and the jolts of launch. The resulting correction equations, expressed as parabolic functions of wavelength scaled by flare position, are now available for users of the data product, though the corrections are not applied automatically because the processing pipeline does not know each flare’s location.
The payoff comes in the flare statistics. For the X2.2 flare of 15 February 2011, the first X-class event of the SDO mission, all chromospheric, transition region, and cool coronal features below 1 million kelvin showed maximum red shifts averaging 75 plus or minus 24 kilometers per second, while hotter coronal lines showed blue shifts averaging minus 114 plus or minus 75 kilometers per second, with the Fe XIV line at 21.14 nanometers reaching an extraordinary minus 213 kilometers per second. The X9.0 flare of 3 October 2024 told a similar story, with downflows averaging 37 plus or minus 16 kilometers per second and upflows averaging minus 94 plus or minus 58 kilometers per second. In both cases, and across a broader sample of 15 disk-center X-class flares, the velocity maxima almost always occurred during the impulsive phase, the brief interval when magnetic reconnection releases energy most furiously.
These patterns match the standard picture of flare physics, often called the CSHKP model, in which reconnection drives chromospheric evaporation upward into hot coronal loops while cooler material drains downward. The transition from red shifts to blue shifts between 1 and 2 million kelvin, first noted by Milligan and Dennis in 2009 using Hinode data, appears clearly in the EVE results. The findings also align with earlier EVE-based analyses, including Hudson and colleagues’ 2011 report of a 50 kilometers-per-second red shift in He II and a 100 kilometers-per-second blue shift in Fe XXIV, and Otsu and Asai’s 2024 detection of a dramatic minus 400 kilometers-per-second blue shift during a filament eruption. For limb flares, the team found that even after location corrections, coronal lines still blue-shift by about 150 kilometers per second relative to the gradual phase, hinting at non-radial outflows that may accompany coronal mass ejections.
The practical lesson for solar physicists is that the EVE Level 4 Lines product, despite the instrument’s modest resolution and full-disk field of view, opens a routine path to measuring flare plasma dynamics across an entire solar cycle. Users must apply the optical wavelength-shift correction based on flare location for anything away from disk center, or risk mistaking instrumental artifacts for solar flows of 50 to 200 kilometers per second. But with 42 X-class flares already analyzed for MEGS-A and 103 for MEGS-B, and countless smaller events awaiting study, the new data product promises to deepen understanding of the magnetic explosions that drive space weather, disturb satellite orbits, and occasionally paint auroras across skies far from the poles.
Subject of Research: Measurement of solar flare Doppler velocities using the SDO EVE Level 4 Lines data product
Article Title: Solar Doppler Velocity Results from the SDO EVE Level 4 Lines Data Product
Article References: Solar Doppler Velocity Results from the SDO EVE Level 4 Lines Data Product. (n.d.). https://doi.org/10.1007/s11207-026-02727-w
Image Credits: AI Generated
DOI: 10.1007/s11207-026-02727-w
Keywords: solar flares, Doppler velocity, SDO, EVE, extreme ultraviolet, corona, transition region, space weather, magnetic reconnection, spectroscopy, Solar Dynamics Observatory, MEGS
Cite Scienmag News
Russell Cooper. (September 22, 2026). New SDO Data Product Tracks Solar Flare Plasma Flows in Unprecedented Detail. Scienmag. https://scienmag.com/new-sdo-data-product-tracks-solar-flare-plasma-flows-in-unprecedented-detail/
Russell Cooper. "New SDO Data Product Tracks Solar Flare Plasma Flows in Unprecedented Detail." Scienmag, 22 September 2026, https://scienmag.com/new-sdo-data-product-tracks-solar-flare-plasma-flows-in-unprecedented-detail/. Accessed 4 October 2026.
Russell Cooper. "New SDO Data Product Tracks Solar Flare Plasma Flows in Unprecedented Detail." Scienmag. September 22, 2026. https://scienmag.com/new-sdo-data-product-tracks-solar-flare-plasma-flows-in-unprecedented-detail/


