


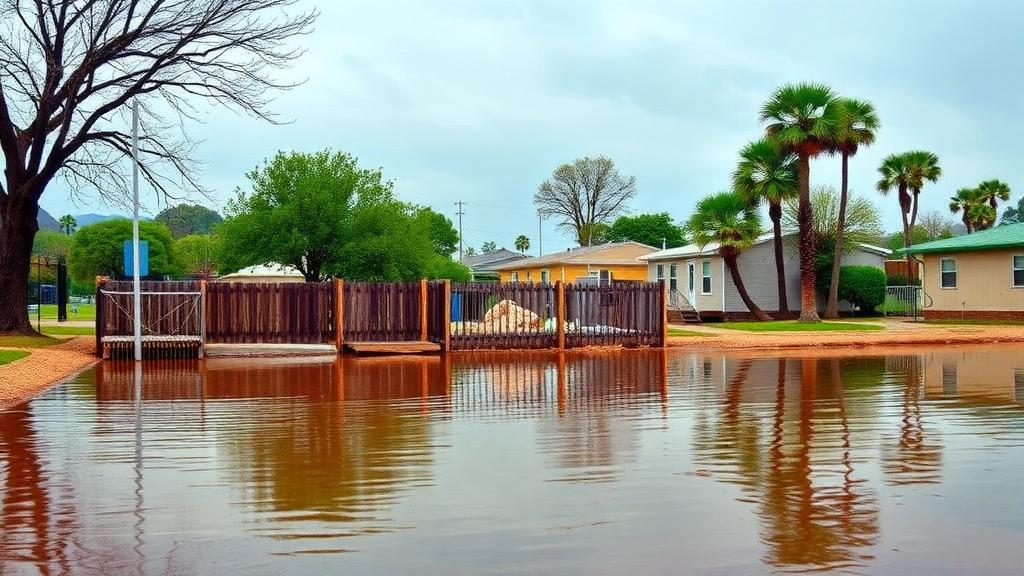
Along the arid coastline where Peru meets Ecuador, the atmosphere keeps a stubborn secret: warm ocean water does not always mean rain. During the record-breaking global El Niño of 2015–2016, sea surface temperatures soared to historic heights, yet the coastal deserts of northwestern South America stayed largely dry. Just one year later, in 2017, a much smaller patch of localized ocean warming unleashed catastrophic floods that devastated communities across the region. A new study published in the journal Weather and Climate Dynamics offers a physical explanation for this maddening inconsistency, and in doing so introduces a diagnostic tool that could sharpen early warning systems for millions of people living in one of the world’s most hydrologically volatile coastal zones.
The research, conducted by Jose Obregon-Yataco of the Instituto Geofísico del Perú, tackles a long-standing blind spot in operational meteorology. Forecasters have traditionally gauged the potential for thunderstorms using thermodynamic indices such as Convective Available Potential Energy, or CAPE, which measures how much buoyant energy is stored in the atmosphere, and the Gálvez-Davison Index, which adds tropical moisture considerations to the mix. But in the coastal strip of northwestern South America, these indices routinely produce false alarms. The reason, the study argues, is that they measure only the fuel for convection, never the ignition. In a region where large-scale sinking air, or subsidence, persistently suppresses rising motion, atmospheric instability is a necessary but fundamentally insufficient condition for rainfall.
The study’s solution is an elegantly simple mathematical construct called the Buoyancy Work Rate, or BWR. The index is computed by multiplying parcel buoyancy, denoted ΔT and representing the temperature excess of a rising air parcel relative to its surroundings, by the vertical velocity ω, and then integrating this product through the entire atmospheric column from the surface to 100 hectopascals. Crucially, only layers where the air is both positively buoyant and moving upward are counted. The result is a single number that quantifies the rate at which potential energy is actually being converted into kinetic energy by active convection. If the atmosphere is loaded with instability but mechanically clamped down by subsidence, the index zeroes out, filtering exactly the false positives that plague purely thermodynamic metrics.
The physical logic draws on a classic result from 1977, when Cornejo-Garrido and Stone showed that within the Walker circulation, the latent heat released by tropical convection is balanced on climatic timescales by the adiabatic cooling produced by large-scale vertical ascent. In other words, vertical motion and deep convection are two sides of the same coin. The coastal region under study sits beneath the descending branch of this circulation, where trade-wind-driven upwelling of cold water and dry leeward flow off the Andes conspire to keep the air stable. Rain falls only during a brief window in the austral summer, peaking in March, when weakening trade winds and warming sea surface temperatures come into phase. When sea surface temperatures in the adjacent Niño 1+2 region cross a critical threshold of roughly 26 degrees Celsius, this stability regime collapses and the system flips into a tightly coupled state where rising motion and latent heating reinforce each other.
To validate the new index, the study deployed a battery of independent tests. First, a causal discovery algorithm called PCMCI+ was applied to more than four decades of monthly data from 1981 to 2025, using the ERA5 reanalysis and two high-resolution precipitation products tailored to Peruvian topography, PISCO and RAIN4PE. The analysis confirmed that the BWR preserves the dominant causal pathway to precipitation, maintaining a robust direct link with a causal strength of 0.60 that exceeds even the local evaporation signal. Second, an upper tail dependence analysis based on empirical copulas, a statistical technique for examining the behavior of joint extremes, revealed that the index’s agreement with precipitation strengthens precisely where it matters most: at the highest quantiles, the tail dependence coefficient climbs to nearly 0.8, indicating that the BWR becomes a highly reliable diagnostic specifically during the most extreme and potentially disastrous events.
The vertical cross-sections of past extreme events tell the story with striking clarity. During the great El Niño of 1998 and the localized coastal event of 2017, anomalous onshore westerly winds, driven by enhanced sea breezes colliding against the western Andean slope, generated deep ascent columns extending from the surface up to 300 hectopascals, ventilated aloft by diverging easterlies. In these years, atmospheric instability and dynamic ascent synchronized perfectly, and the product of the two peaked between 500 and 400 hectopascals, exactly where the BWR registers its strongest signal. The 2016 event, by contrast, revealed the opposite configuration: a severe layer of mid-level subsidence centered near 600 hectopascals physically severed the atmospheric column, neutralizing surface convergence and capping the instability despite abundant oceanic warmth. The BWR captured this structural decoupling, correctly yielding neutral to negative anomalies where conventional indices screamed flood.
Beyond diagnosis, the index exhibits a subtle but operationally valuable property: memory. Mid-level vertical velocity alone, while dictating instantaneous convection, decorrelates rapidly and is too volatile for continuous monitoring. Because the BWR integrates the buoyancy term, which is anchored to slowly evolving sea surface temperatures through the Clausius-Clapeyron relationship, it inherits the thermal inertia of the ocean. Autocorrelation analysis shows the index retains signal persistence far longer than vertical velocity by itself, making it a more stable proxy for sub-seasonal monitoring. It is, in effect, a physical trade-off: a marginal sacrifice of precision at the extreme tail in exchange for substantial gains in temporal stability.
The most consequential finding, however, concerns seasonal forecasting. Climate models such as the European Centre for Medium-Range Weather Forecasts’ SEAS5 system struggle to predict precipitation in this region because rainfall generation depends on sub-grid convective parameterizations, the simplified schemes that stand in for processes far smaller than the model’s grid cells. When Obregon-Yataco substituted the model’s direct precipitation output with BWR anomalies computed from the model’s predicted wind and temperature fields, predictive skill improved consistently. During the peak rainy season of February through April, forecasts initialized in November and December gained roughly 0.1 to 0.2 in correlation skill. More remarkably, at extended lead times of five to six months, targeting the austral spring, the improvement exceeded 0.3, meaning the index retains skill across the boreal spring predictability barrier that typically degrades long-range forecasts.
The explanation for this advantage is rooted in the hierarchy of physical equations. Vertical motion and temperature structure are explicitly resolved by the primitive equations governing the model dynamics, whereas parameterized rainfall inherits all the microphysical uncertainties of those schemes. By treating the BWR as a physical translator, forecasters can effectively sidestep the weakest link in the modeling chain and read the convective state directly from variables the model simulates with greater fidelity. The index also depends on surface dew point temperature, which is tightly constrained by local ocean conditions, rather than on free-tropospheric humidity, a quantity notorious for inter-model spread and systematic bias.
The study is candid about limitations. The BWR lacks an explicit humidity term, so it can produce false positives during dry ascent, when strong lifting occurs in moisture-starved air. It is integrated through the full troposphere and therefore misses shallow, warm-rain convection. Its skill degrades over the Amazon basin and the eastern Andes, where precipitation is governed by convective inhibition, orographic lifting, and mesoscale systems too fine for global reanalyses to resolve. And beyond the tropics, where baroclinic instability and frontal lifting dominate, the formulation becomes physically inconsistent. Yet within its intended domain, the dynamically limited coastal zone of northwestern South America, the index condenses a complex three-dimensional convective state into a rapidly interpretable two-dimensional field, distinguishing active convective engines from thermodynamically primed but dynamically suppressed atmospheres. For a region repeatedly battered by floods in 1983, 1998, 2017, and 2023, that distinction could mean the difference between a timely evacuation and a catastrophe caught off guard.
Subject of Research: A coupled dynamic-thermodynamic index for diagnosing and predicting monthly precipitation anomalies in northwestern South America
Article Title: Explaining monthly precipitation anomalies in northwestern South America by integrating vertical dynamics and energetics
Article References: Obregon-Yataco, J. (2026). Explaining monthly precipitation anomalies in northwestern South America by integrating vertical dynamics and energetics. Weather and Climate Dynamics, 7(3), 1547-1570. https://doi.org/10.5194/wcd-7-1547-2026
Image Credits: AI Generated
Keywords: El Niño, precipitation anomalies, convection, Buoyancy Work Rate, Peru, Ecuador, seasonal forecasting, Walker circulation, vertical velocity, CAPE, ERA5, early warning systems
Cite Scienmag News
Russell Cooper. (October 10, 2026). New Buoyancy Index Explains Why Some El Niño Years Bring Floods and Others Stay Dry. Scienmag. https://scienmag.com/new-buoyancy-index-explains-why-some-el-nino-years-bring-floods-and-others-stay-dry/
Russell Cooper. "New Buoyancy Index Explains Why Some El Niño Years Bring Floods and Others Stay Dry." Scienmag, 10 October 2026, https://scienmag.com/new-buoyancy-index-explains-why-some-el-nino-years-bring-floods-and-others-stay-dry/. Accessed 10 October 2026.
Russell Cooper. "New Buoyancy Index Explains Why Some El Niño Years Bring Floods and Others Stay Dry." Scienmag. October 10, 2026. https://scienmag.com/new-buoyancy-index-explains-why-some-el-nino-years-bring-floods-and-others-stay-dry/


