


Phosphorus is the quiet engine of life. It sits at the heart of DNA, powers the transfer of energy in every living cell, and sets the pace of plant growth across much of the planet. Yet this same element, mined from ancient rock and spread across the world’s fields, has become one of the most disruptive forces in the modern Earth system. A new dataset published in the journal Earth System Science Data now offers the most detailed picture ever assembled of how humanity has rewired the global phosphorus cycle over the past 160 years, and the numbers are staggering.
The dataset, called the History of Anthropogenic Phosphorus Inputs, or HaPi, was constructed by an international team led by Zihao Bian of Nanjing Normal University and Hanqin Tian of Boston College. It tracks human-driven phosphorus fluxes to the terrestrial biosphere from 1860 to 2020 at a spatial resolution of 5 arc-minutes, roughly 10 kilometers at the equator, with an annual time step. That combination of temporal depth and spatial detail is unprecedented for phosphorus. Where earlier datasets offered either coarse global totals for a few decades or fine-grained snapshots of a single year, HaPi stitches the entire industrial era into one harmonized, gridded record.
The headline finding is a nearly elevenfold increase in total phosphorus input to land. In the 1860s, human activities added about 3.8 teragrams of phosphorus per year to the terrestrial biosphere. By the 2010s, that figure had climbed to 41.0 teragrams per year. Mineral fertilizer and livestock manure contributed almost equally to the increase, accounting for 52 percent and 46 percent of the growth respectively. The steepest acceleration came between 1945 and 1989, the era of post-war agricultural intensification, when synthetic phosphate fertilizers, mechanized farming, and booming livestock herds transformed agriculture across the industrialized world.
The composition of phosphorus inputs shifted dramatically along the way. Before the 1980s, livestock manure accounted for more than half of all phosphorus reaching the land surface. By the 2010s, mineral fertilizer had overtaken manure as the largest single input for the first time in the record. Atmospheric phosphorus deposition, by contrast, tells a story of relative decline: although it rose modestly from 2.0 to 2.7 teragrams per year between the 1960s and 2010s, its share of the total collapsed from 50 percent in the 1860s to just 7 percent today, swamped by the sheer scale of deliberate fertilizer and manure applications.
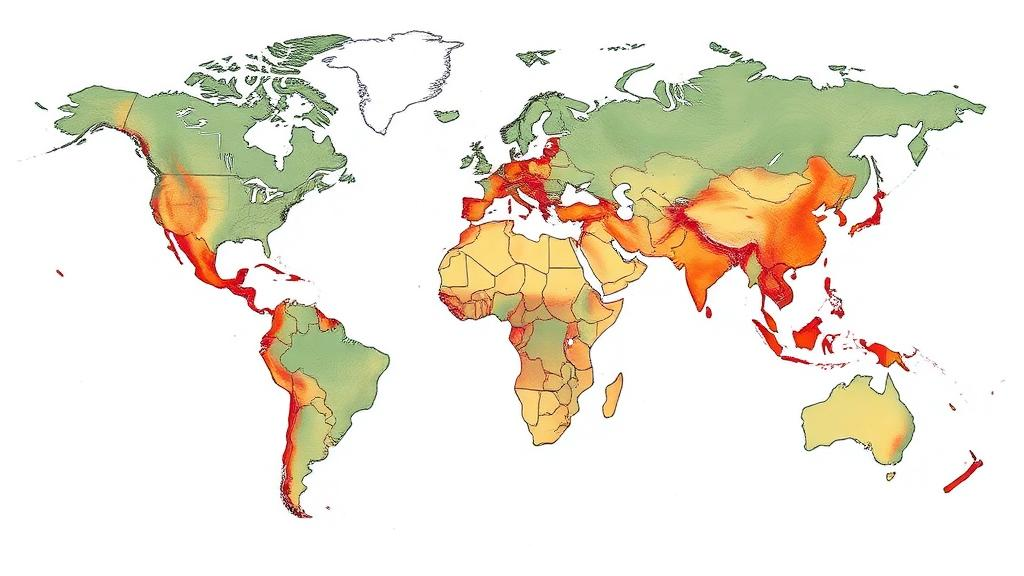
The geography of phosphorus has also been redrawn. In the 1960s, Europe and the United States dominated, receiving 5.2 and 2.8 teragrams per year respectively and together consuming the majority of the world’s mineral fertilizer. In recent decades, China, South Asia, and Brazil have surged past them. By the 2010s, China alone accounted for 30 percent of global phosphorus fertilizer consumption and South Asia for 20 percent, while hotspots of high input emerged across eastern China, northern India, southern Brazil, and eastern Africa. Notably, China’s total inputs began to decline around 2010, and its fertilizer consumption has fallen since 2013, likely reflecting the exploitation of legacy phosphorus accumulated in soils over decades of heavy application.
Building such a dataset required reconciling an unruly collection of statistical and geospatial sources. National fertilizer consumption figures from the Food and Agriculture Organization, available only from 1961 onward, were split between cropland and pasture using observed nitrogen allocation patterns, then distributed across grid cells using land use maps, crop rotation data, and crop-specific application rates for 17 major crops. For the pre-1961 era, when guano and human excreta still mattered and phosphate rock had yet to be widely adopted, the team applied global change rates derived from historical estimates to back-cast the 1961 spatial pattern. Livestock manure inputs were generated by multiplying gridded manure nitrogen data from the team’s companion nitrogen dataset, HaNi, by annually varying, animal-number-weighted phosphorus-to-nitrogen ratios for eight livestock species.
Atmospheric deposition posed its own challenge. The researchers compiled a global phosphorus emission inventory spanning natural sources such as dust, sea salt, volcanic emissions, primary biological aerosol particles, and wildfires, together with anthropogenic emissions from the EDGAR database. This inventory fed the GEOS-Chem atmospheric chemistry model, driven by NASA meteorology, to simulate deposition from 2001 to 2019 at a coarse resolution. A machine-learning downscaling algorithm, trained separately for eight world regions against climate, vegetation, and aerosol variables, then sharpened the output to 0.1 degrees before it was resampled to match the rest of the dataset and extended back to 1900.
The scientific payoff is substantial. Because phosphorus is the limiting nutrient for phytoplankton in most freshwaters, runoff from over-fertilized fields drives eutrophication, algal blooms, and dead zones in rivers, lakes, and coastal oceans worldwide. Worse, legacy phosphorus banked in soils from historical applications continues to leach into waterways decades later, undermining conservation investments. HaPi’s explicit treatment of grasslands, which received over 70 percent of global manure phosphorus and more than 40 percent of total phosphorus inputs, is particularly valuable, since grasslands are often overlooked in nutrient budgets even as they face a negative phosphorus balance and contribute heavily to nutrient loading in systems such as the Gulf of Mexico.
The dataset also arrives at a geopolitically charged moment. Phosphate rock is a finite, unevenly distributed resource, and its concentration in a handful of countries creates vulnerabilities for global food systems. By quantifying where phosphorus has been applied, where it has accumulated, and where efficiency gains are possible, HaPi gives researchers and policymakers a common evidentiary foundation for managing nutrient resources, improving phosphorus use efficiency, and feeding Earth system models with consistent forcing data. The team is candid about limitations, including a fixed spatial baseline for fertilizer patterns, uncertainties of at least 20 percent inherited from national statistics, and the omission of minor historical sources such as guano and livestock bones. Even so, as an open, peer-reviewed record spanning 160 years, HaPi transforms our understanding of one of humanity’s most consequential geochemical interventions, and it will shape research on food security and water quality for years to come.
Subject of Research: Global anthropogenic phosphorus inputs to the terrestrial biosphere from 1860 to 2020
Article Title: History of anthropogenic Phosphorus inputs (HaPi) to the terrestrial biosphere from 1860 to 2020
Article References: Bian, Z., Shi, H., Li, R., Lun, F., Tubiello, F. N., Mueller, N. D., You, S., Hao, R., Ma, J., Li, L., Huang, C., He, B., Yao, Y., & Tian, H. (2026). History of anthropogenic Phosphorus inputs (HaPi) to the terrestrial biosphere from 1860 to 2020. Earth System Science Data, 18(10), 7125-7141. https://doi.org/10.5194/essd-18-7125-2026
Image Credits: AI Generated
DOI: 10.5194/essd-18-7125-2026
Keywords: phosphorus cycle, fertilizer, livestock manure, eutrophication, Earth system science, nutrient budgets, agriculture, biogeochemistry, water quality, legacy phosphorus, global dataset, planetary boundaries
Cite Scienmag News
Chloe Pearson. (October 10, 2026). New 160-Year Map Reveals Humanity’s Tenfold Surge in Phosphorus Pollution. Scienmag. https://scienmag.com/new-160-year-map-reveals-humanitys-tenfold-surge-in-phosphorus-pollution/
Chloe Pearson. "New 160-Year Map Reveals Humanity’s Tenfold Surge in Phosphorus Pollution." Scienmag, 10 October 2026, https://scienmag.com/new-160-year-map-reveals-humanitys-tenfold-surge-in-phosphorus-pollution/. Accessed 10 October 2026.
Chloe Pearson. "New 160-Year Map Reveals Humanity’s Tenfold Surge in Phosphorus Pollution." Scienmag. October 10, 2026. https://scienmag.com/new-160-year-map-reveals-humanitys-tenfold-surge-in-phosphorus-pollution/


