


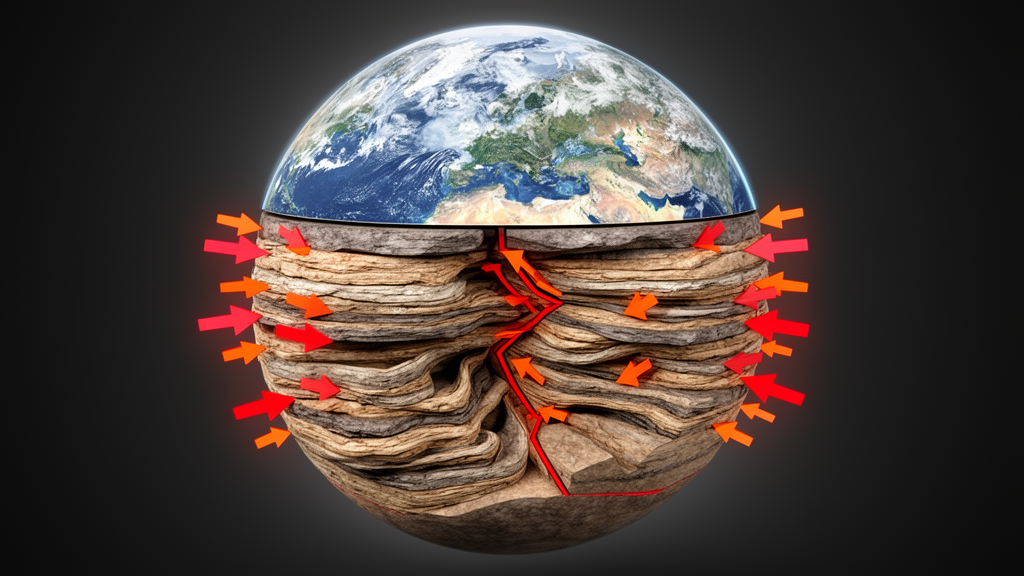
Beneath every continent, the rocks of Earth’s crust are being squeezed, stretched and sheared by forces that most of us never notice. For four decades, scientists have tried to chart this hidden landscape of pressure, and now the most comprehensive picture ever assembled has arrived. The World Stress Map project, the only open-access global database of crustal stress information, has released its 2025 edition to mark the project’s 40th anniversary, and the results are forcing geoscientists to rethink one of the founding assumptions of their field. The new database, compiled by Oliver Heidbach of the GFZ Helmholtz Centre for Geosciences and Mojtaba Rajabi of the University of Queensland and published in the journal Solid Earth, contains 100,842 quality-ranked records of the orientation of the maximum horizontal stress, more than double the number in the previous 2016 release.
The quantity that the database tracks, known to geoscientists as SHmax, is the compass direction in which the greatest horizontal compression pushes through the crust at any given location. That single number matters enormously. It governs which faults are likely to slip in an earthquake, how tunnels and boreholes deform, whether deep geothermal reservoirs can be fractured safely, and where carbon dioxide or hydrogen can be stored underground without compromising the rock’s integrity. As humanity prepares to use the subsurface on an unprecedented scale, from geo-energy storage to radioactive waste repositories planned at depths of 400 to 1,000 metres, knowing the direction of maximum compression has become a practical necessity rather than an academic curiosity.
The story of measuring this stress stretches back nearly a century. The first crustal stress data were collected in the 1930s using surface relief methods, followed in the 1950s by flat jack and borehole relief techniques. The 1970s brought hydraulic fracturing, which measures the magnitude of the least principal stress, and the late 1970s introduced borehole breakouts, the tell-tale elongations that a drill bit leaves in rock when the surrounding compression is uneven. Meanwhile, the expansion of global seismological networks in the 1960s allowed earthquake focal mechanisms to serve as stress indicators for the deeper crust. These techniques converged in 1986, when the World Stress Map project was launched as a task force of the International Lithosphere Program, with a bold initial goal: to test the mid-1960s hypothesis that plate tectonic forces alone control the orientation of maximum horizontal stress in the crust.
For a while, the hypothesis held up. The first database release in 1989, containing 3,574 quality-ranked records, broadly supported the idea that the push and pull at plate boundaries dictates the stress compass. But the 1992 release, with roughly 7,300 records, already hinted at complications: lateral density and strength contrasts within the plates were producing stress patterns with wavelengths of several hundred kilometres. The 2005 release, comprising 15,969 records, confirmed those second-order patterns and revealed the first examples of stress rotations on smaller scales. Now, with the 2025 release, the expansion has been dramatic. Much of the growth comes from integrating the global compilation of earthquake focal mechanisms from the International Seismological Centre, along with more than 4,000 new records derived from boreholes around the world.
Integrating such wildly different measurement techniques is the database’s central technical challenge, and it is solved through a rigorous quality-ranking scheme. The 2025 edition employs eight established stress indicators, from overcoring, which samples rock volumes of roughly a cubic metre, to single earthquake focal mechanisms, which sample volumes on the order of a billion cubic metres. Each record is assigned a quality class from A to E, with A-quality data accurate to within plus or minus 15 degrees, B-quality to 20 degrees, C-quality to 25 degrees and D-quality to 40 degrees. Only A, B and C records are considered reliable for interpreting geodynamic processes. The 2025 scheme refines the older rules with hard-edged criteria suitable for automated Python-based assignment in the project’s new database infrastructure, called MaRS. It introduces a new X-quality class for records with missing information, rarely used indicators or methods not yet established, and tightens requirements for borehole breakouts, drilling-induced tensile fractures, hydraulic fracturing tests and overcoring measurements.
Because stress data are heavily clustered around plate boundaries and in sedimentary basins, raw records alone cannot reveal global patterns. To overcome this, the team computed mean SHmax orientations on regular global grids of 2, 1, 0.5 and 0.2 degrees, using search radii between 50 and 500 kilometres and producing 13 distinct datasets that filter the stress pattern at different wavelengths. The averaging relies on circular statistics for axial data, weighting each record by its quality class and by its inverse distance from the grid point, with a minimum distance threshold to prevent very nearby records from being overrepresented. A minimum of five records is required within each search radius, and all must lie on the same tectonic plate as the grid point, according to the global plate boundary model PB2002. The result is a family of stress maps that can zoom from continental sweeps down to regional detail.
What those maps reveal is striking. In many intraplate regions, where data density has increased most dramatically, the old hypothesis that plate boundary forces and relative plate motion primarily control the stress orientation needs to be revised. The maximum horizontal stress rotates in some areas by more than 50 degrees over spatial scales of just 50 to 500 kilometres. In the foreland of the Alps, the stress direction swings by roughly 50 degrees, from north-south in the east to about N130°E in the western Alps, driven by the excess gravitational potential energy of the high topography, which pushes the crust outward perpendicular to the mountain belt’s strike. Comparable patterns appear in the greater Himalaya region and the Rocky Mountains of Canada. Even more dramatic are rotations exceeding 50 degrees over distances of less than 100 kilometres in eastern Australia.
Australia’s Bowen Basin offers a particularly instructive natural experiment. An exceptionally dense dataset from 680 vertical boreholes spread over an area of 300 by 100 kilometres in the basin’s northern part shows no lateral or vertical variation in stress orientation at all, despite the presence of a fault network and lateral stiffness contrasts; the mean orientation is N18°E with a standard deviation of plus or minus 18 degrees. Yet further south, in the southern Bowen Basin and the overlying Surat Basin, the stress orientation rotates by up to 60 degrees within 100 kilometres. Similar rotations in the greater Texas-New Mexico region occur without significant topography and show no correlation with faults, and the rotations are gradual, supporting the interpretation that faults exert limited control on the stress field beyond distances of a few kilometres, if at all. The key, the authors suggest, lies in the magnitude of the horizontal differential stress: where several plate tectonic forces superimpose and the difference between the maximum and minimum horizontal stress magnitudes is small, regional topography and stiffness contrasts gain relatively greater leverage and can twist the stress compass substantially. In northeastern Australia, forces from the Solomon subduction and New Guinea collision zone dominate, but further south the added influence of the New Hebrides subduction zone may create a low-differential-stress state ripe for rotation.
Not everywhere is so chaotic. Large intraplate regions such as central western Europe and northeastern North America show remarkably uniform stress orientations over distances greater than 1,000 kilometres, parallel to the direction of absolute plate motion, confirming that plate tectonic forces remain the primary control in those settings. The new database also confirms that stress orientation generally does not rotate with depth: the vast majority of records from deep boreholes show no significant rotation, and no systematic difference emerges between shallow borehole data and earthquake-derived data from greater depths, with exceptions mainly where boreholes cross faults or where mechanical decoupling horizons exist. The stress regime, by contrast, does change with depth, which matters for practical applications, since maps dominated by earthquake data reflect conditions where earthquakes nucleate rather than the shallow conditions relevant to repositories and reservoirs.
The implications ripple outward from pure geodynamics to the energy transition. Stress rotations serve as proxies, together with geomechanical-numerical models, for quantifying the relative importance of plate boundary forces against regional and local controls, and they directly affect assessments of tectonic fault criticality and the safe design of geothermal systems and storage sites. The project is now expanding beyond orientations to compile stress magnitude data, beginning with Germany and neighbouring countries, and developing a corresponding quality-ranking scheme. With 77,365 A-to-C-quality records now plotted on a single global map, and user-defined stress maps available through the project’s online tool, the hidden architecture of pressure beneath our feet has never been so clearly visible, or so full of surprises.
Subject of Research: Contemporary crustal stress orientation patterns from the World Stress Map Database 2025
Article Title: Patterns of contemporary horizontal stress orientation in the Earth's crust derived from the World Stress Map Database 2025
Article References: Heidbach, O., & Rajabi, M. (2026). Patterns of contemporary horizontal stress orientation in the Earth's crust derived from the World Stress Map Database 2025. Solid Earth, 17(5), 735-745. https://doi.org/10.5194/se-17-735-2026
Image Credits: AI Generated
Keywords: World Stress Map, crustal stress, maximum horizontal stress, plate tectonics, geomechanics, SHmax orientation, intraplate stress rotations, borehole breakouts, earthquake focal mechanisms, Alpine foreland, Bowen Basin, geothermal energy
Cite Scienmag News
Violet Maxwell. (October 9, 2026). Massive New Stress Map Reveals Earth’s Crust Is Far More Twisted Than We Thought. Scienmag. https://scienmag.com/massive-new-stress-map-reveals-earths-crust-is-far-more-twisted-than-we-thought/
Violet Maxwell. "Massive New Stress Map Reveals Earth’s Crust Is Far More Twisted Than We Thought." Scienmag, 9 October 2026, https://scienmag.com/massive-new-stress-map-reveals-earths-crust-is-far-more-twisted-than-we-thought/. Accessed 9 October 2026.
Violet Maxwell. "Massive New Stress Map Reveals Earth’s Crust Is Far More Twisted Than We Thought." Scienmag. October 9, 2026. https://scienmag.com/massive-new-stress-map-reveals-earths-crust-is-far-more-twisted-than-we-thought/

