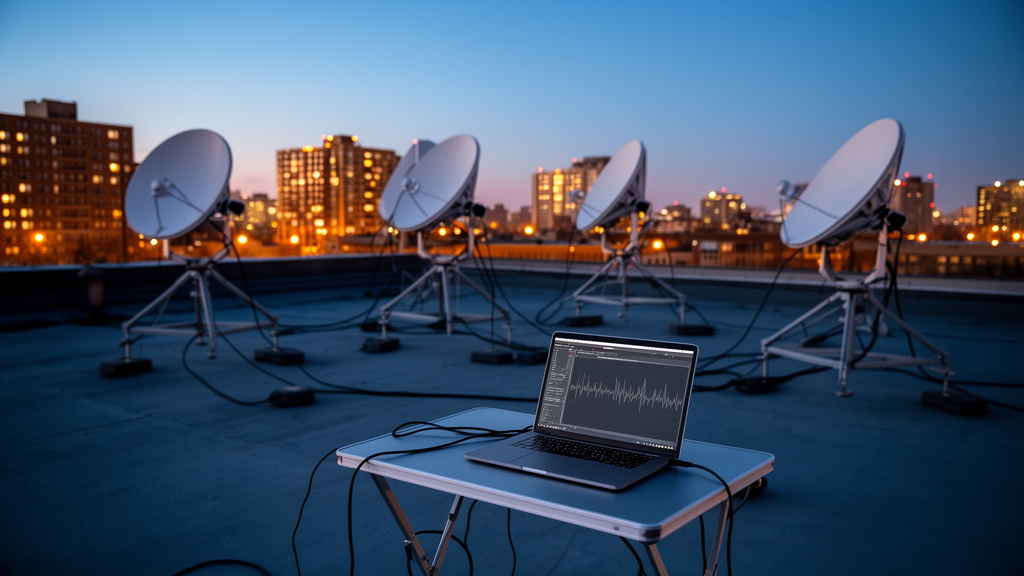
The work, published in Astrophysics and Space Science, uses baseband recordings from the university’s 4 m × 4.5 m radio telescope array, which operates on a city campus without any radio-quiet zone protection. Signals from communication infrastructure, Wi-Fi networks, drones, and the receiver’s own electronics can mask faint astronomical emission, making reliable interference recognition essential for both data quality and site monitoring.
The research team, led by Guiyuan Wang with colleagues including Baoqiang Lao and D. Y. Yan, built a pipeline that tackles two problems at once: assigning one of seven morphology labels to each spectrogram tile, and producing a spatial mask showing where the interference sits within the tile. The seven classes are Background, Continuous Wave, Pulsed Narrowband, Slow Drift, Linear Chirp, Frequency Hopping, and Composite RFI. Each label describes time–frequency structure rather than a confirmed emitter, and the authors are explicit that the Pulsed Narrowband label refers to an interference shape, not astrophysical pulsar emission, which would require calibrated axes plus dispersion and periodicity tests outside this protocol.
Label scarcity was the central obstacle. The team maintained three disjoint pools: a manually annotated pool with a 355-sample seed set and a fully annotated 432-sample gold-standard test set locked before training, a 12,000-slice unlabeled pool, and an independent field pool of more than 10,000 samples reserved for an exploratory case study. A teacher model trained on the seed set processed the unlabeled slices; quality control and deduplication retained 4150 candidates, and confidence thresholding at 0.95 plus deterministic morphology and quality checks removed 195 of them. Combining the surviving pseudo-labels with the seed set produced 4310 development samples, split into 3448 for training and 862 for validation. Splits were made by source file, session, and acquisition day, so raw files, macro-chunks, and adjacent slices could not cross between sets.
The classifier at the heart of the study, called SmallCNN_GN_V2, is intentionally shallow. Three convolutional blocks with 16, 32, and 64 channels, each paired with group normalization and max pooling, process a 512 × 128 frequency-by-time tile. The authors note that most of the model’s 8.41 million parameters sit in the fully connected head, so its advantage lies in low arithmetic cost and latency rather than a minimal parameter count. Group normalization was chosen because the data are strongly long-tailed and deployment may require small batches; unlike batch normalization, it does not rely on batch statistics or class-biased running averages.
On the 432-sample gold-standard test set, which was enriched with 100 samples from the three rare classes, SmallCNN_GN_V2 reached 95.37% accuracy, 94.82% macro-F1, and 92.00% rare-class recall, correctly classifying 92 of 100 rare-class samples. Wilson 95% intervals computed from the integer outcomes span 92.96–96.98% for accuracy and 85.00–95.89% for rare recall, and the authors caution that these intervals describe sampling uncertainty for this fixed, class-enriched test set, not variation across training seeds or sites. Against baselines trained under the same progressive strategy, the model beat a batch-normalization twin on rare recall (92 versus 83), outperformed ResNet-18 on accuracy and tail recall while cutting FLOPs by about 92% and batch-1 latency from 2.24 to 0.43 ms, and clearly surpassed the AstroCNN_RFI reference, which managed only 73 of 100 rare-class samples.
Efficiency was measured carefully but narrowly. Benchmarked on an NVIDIA A40 GPU with batch size 1, the mean forward-pass latency is 0.43 ms per tile with a 95th-percentile of 0.55 ms, and 7.30 ms on an 8-thread Intel Xeon CPU. These timings exclude file input–output, the short-time Fourier transform, bandpass flattening, host–device transfer, and buffering, so the authors describe the A40 figure as an accelerator-side reference rather than an end-to-end deployment measurement. The model requires 0.34 GFLOPs per tile, and the eight classification errors on the test set cluster in confusions among visually similar rare morphologies and Pulsed Narrowband.
The second half of the pipeline extends image-level labels to spatial localization. Because image labels do not identify contaminated pixels, the team converted reviewed spectrograms into a weak segmentation dataset using class-aware rules: persistent narrow bands for Continuous Wave, separated local bursts for Pulsed Narrowband, elongated slopes for Slow Drift and Linear Chirp, and disconnected segments for Frequency Hopping. The rules were tuned to avoid bridging separated pulses and to retain faint hopping components. These masks were spot-checked by humans rather than densely annotated at the pixel level; of 78 held-out examples reviewed, 73 were accepted outright, three needed minor fixes, and two were rejected, giving 93.59% strict acceptance. A lightweight U-Net-like decoder attached to the classifier outputs a binary mask and seven class logits per tile, with the mask threshold calibrated to 0.90 on the validation set.
On a reviewed 1217-tile test subset, grouped so that no source bin, path, basename, offset, or array fingerprint overlapped between splits, the joint model achieved 68.97% precision, 80.56% recall, 74.31% Dice/F1, and 59.13% IoU against the weak masks, while retaining 90.68% image-level classification accuracy and 89.32% macro-F1. Under the same tile protocol, an AOFlagger-like statistical baseline using robust normalization, thresholding, connected-component filtering, and dilation reached 66.05% precision but only 44.71% recall, yielding 53.33% Dice/F1 and 36.36% IoU. The authors stress repeatedly that these numbers quantify agreement with the refined weak targets, not accuracy against dense manual annotations, and that the baseline is a controlled non-learning reference, not official AOFlagger performance.
Applied to more than 10,000 independent unlabeled field samples from later sessions, the trained classifier produced exploratory activity patterns binned by approximate file modification time, since calibrated observation times are incomplete. Predicted Slow Drift counts rose around 05:00–07:00, motivating checks of receiver and ambient temperature logs, while Pulsed Narrowband counts increased near 23:00, prompting comparison with equipment schedules and nighttime spectrum records. The team emphasizes that these patterns support follow-up hypotheses only, because transfer or reprocessing can alter file timestamps and because reliable source attribution would require calibrated frequency and time, antenna pointing, direction finding, and independent spectrum monitoring that are incomplete here.
The authors frame the work as a site-specific, closed-set study with clear limits: one site, seven predefined classes, weak segmentation labels, approximate temporal metadata, and no cross-site or open-set testing. Its relevance to pulsar searches is prospective rather than demonstrated. Impulsive and periodic interference can create false candidates in pulsar-search pipelines, and a morphology-aware preflagging stage could help suppress them, but the study includes no pulsar-recovery experiment, no injected dispersed pulses, and no observations of known pulsars, so any effect on pulsar detection or timing performance remains untested. Future work, the team writes, should add dense expert masks with inter-rater agreement, test cross-site transfer, profile end-to-end latency on edge hardware, compare with AOFlagger on native visibilities or Measurement Set products, and run a dedicated pulsar validation measuring recovery as a function of dispersion measure, pulse width, period, and signal-to-noise ratio.
Subject of Research: Machine-learning-based radio frequency interference classification and weakly supervised time–frequency flagging for a small radio telescope array
Article Title: RFI classification and weakly supervised time–frequency flagging with confidence-screened pseudo-label expansion for a small radio telescope array
Article References: Wang, G., Zhao, R., Xiao, W., You, Z., Lao, B., Liu, H., Lu, Y., Huang, X., Mu, H., Zhu, L., Tu, Z., Zhi, Q. J., Zhou, Q., Zhou, Y., & Yan, D. Y. (2026). RFI classification and weakly supervised time–frequency flagging with confidence-screened pseudo-label expansion for a small radio telescope array. Astrophysics and Space Science, 371(10), Article 127. https://doi.org/10.1007/s10509-026-04656-3
Image Credits: AI Generated
DOI: 10.1007/s10509-026-04656-3
Keywords: radio frequency interference, radio telescope, machine learning, convolutional neural network, pseudo-labeling, weak supervision, spectrogram classification, segmentation, AOFlagger, Guizhou Normal University, pulsar searches, low-latency inference
Cite Scienmag News
Grant Pearson. (October 28, 2026). Lightweight AI learns to spot radio interference at a small urban telescope array. Scienmag. https://scienmag.com/lightweight-ai-learns-to-spot-radio-interference-at-a-small-urban-telescope-array/
Grant Pearson. "Lightweight AI learns to spot radio interference at a small urban telescope array." Scienmag, 28 October 2026, https://scienmag.com/lightweight-ai-learns-to-spot-radio-interference-at-a-small-urban-telescope-array/. Accessed 29 October 2026.
Grant Pearson. "Lightweight AI learns to spot radio interference at a small urban telescope array." Scienmag. October 28, 2026. https://scienmag.com/lightweight-ai-learns-to-spot-radio-interference-at-a-small-urban-telescope-array/