


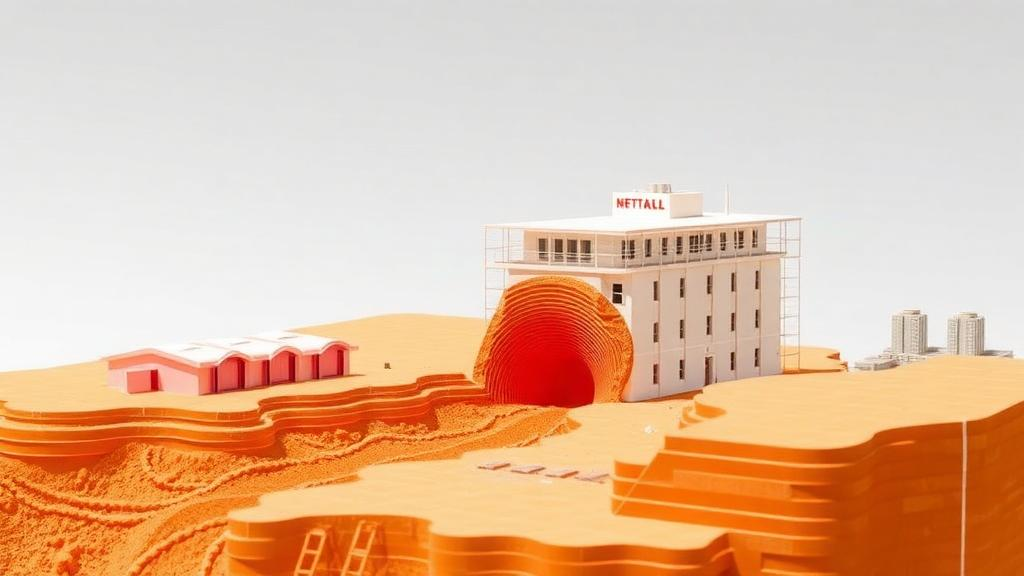
When an earthquake ruptures a fault that reaches the surface, the ground does not simply shake. It tears. Buildings that straddle the rupture can be split, tilted, and dropped as the earth beneath their foundations lurches by meters in a fraction of a second. For planners and engineers, the safest strategy is often the simplest one: keep new construction far enough away from active fault traces that a future rupture will never reach it. But how far is far enough? A new experimental study published in the Bulletin of Earthquake Engineering offers some of the most detailed physical-model evidence yet for answering that question at sites underlain by active normal faults, where the hanging wall of the fault drops downward relative to the footwall during an earthquake.
A team led by Jianke Ma and Tingkai Nian of Dalian University of Technology, together with colleagues at the University of Emergency Management, the Institute of Engineering Mechanics of the China Earthquake Administration, and other Chinese institutions, conducted six large-scale physical model tests at normal gravity, so-called 1 g tests, to watch how a normal-fault rupture propagates upward through overlying soil and interacts with a shallow rectangular foundation placed in its path. Unlike centrifuge experiments, which scale gravity upward to reproduce deep soil stresses in miniature, 1 g testing at large model scale preserves realistic stress conditions in a more direct way for shallow soil profiles, and it allows researchers to instrument the soil and the foundation densely enough to track the full evolution of damage from the first microcrack to final collapse-like deformation.
The experimental setup simulated the permanent ground deformation produced by quasi-static offset of bedrock along a normal fault. In other words, the models captured the slow, monotonic dislocation of the fault block that accompanies surface faulting, not the transient shaking and inertial forces of seismic waves. This distinction matters for engineering practice: near a surface rupture, the permanent offset itself is usually the dominant cause of foundation damage, and isolating it in the laboratory lets researchers attribute every measured response, from soil pressure changes to foundation tilt, directly to the propagating rupture rather than to superimposed vibration.
Each test varied a small number of controlling parameters that engineers and geologists know from field experience to be decisive. The team changed the type of overburden soil, using both clayey and sandy cover sequences; the thickness of that overburden; the dip angle of the fault; and the magnitude of the imposed bedrock fault offset. By watching how the rupture zone widened, how ground deformation spread laterally, and how the foundation responded in each configuration, the researchers could map the domain within which a rectangular shallow foundation would be measurably affected by a future surface rupture.
The experiments revealed a clear three-stage progression in how rupture develops through the soil cover. In the first stage, microcrack damage accumulates as the rising fault tip deforms the overburden without yet forming a through-going shear zone. In the second stage, individual cracks propagate, coalesce, and concentrate into a discrete rupture zone that climbs toward the surface, often refracting and branching as it passes through materials of different stiffness. In the third stage, the rupture reaches a stable configuration in which additional bedrock offset widens and intensifies the deformed zone without fundamentally changing its geometry. Recognizing which stage a site-scale model has reached is central to judging how much of the ground surface is genuinely at risk.
Three factors emerged as the primary controls on the final size of the rupture and deformation domain: fault dip, overburden thickness, and soil type. Steeper faults tend to focus deformation into narrower zones, while gentler dips spread the shear and its associated surface warping over a wider swath. Thicker overburden gives the rupture more room to refract and diffuse, generally broadening the zone of visible ground deformation even as it attenuates the sharpness of the offset. Clayey soils, which can sustain cohesive shear bands and tensile cracks, behave differently from sandy soils, in which deformation distributes through dilatant shear zones whose geometry depends strongly on density and confining stress. Because real fault zones cut through layered, heterogeneous cover sequences, the study’s systematic variation of these parameters provides a practical envelope rather than a single universal number.
To translate the measured rupture, deformation, and foundation response characteristics into a usable planning tool, the team established a multi-indicator envelope procedure. Rather than relying on one criterion, such as the visible trace of the surface scarp, the procedure integrates six independent indicators: the internal development of the rupture within the soil, the pattern of ground surface deformation, the variation of soil pressure around the foundation, the tilt of the foundation, the strain measured at the foundation base, and the distribution of contact pressure between the foundation and the soil beneath it. The setback distance is then taken as the envelope that encloses the region in which any of these indicators shows meaningful influence from the rupture. This approach is conservative by design, because it captures effects, such as subtle changes in contact pressure or small foundation rotations, that a purely visual mapping of surface cracks would miss.
Under the adopted similarity relationship, which scales the laboratory measurements up to prototype dimensions, the results give concrete numbers for setback widths. For a 30-meter-thick clayey overburden, the total setback width ranged from 30.0 to 43.5 meters depending on the fault dip and offset conditions tested. Halving the clayey overburden thickness to 15 meters reduced the total setback width to 24.0 meters, reflecting the narrower deformation domain that develops when the rupture has less soil to traverse. For sandy overburden, the total setback width fell between 21.0 and 30.0 meters. These figures apply to rectangular shallow foundations of the type tested and to the normal-faulting configurations examined, but they provide a physically grounded starting point for site-specific assessment in active fault zones.
One of the most consistent findings across all six tests was asymmetry: the setback distance required on the hanging-wall side of the fault was always larger than the distance required on the footwall side. This makes mechanical sense for normal faulting, because the downward-moving hanging wall drags the overlying soil into a wider zone of extension, warping, and subsidence, while the footwall side experiences comparatively localized deformation near the fault trace. For land-use planning, the implication is direct: a symmetric setback band drawn around a mapped normal fault trace will underprotect the hanging-wall side and overconstrain the footwall side. Asymmetric setbacks, calibrated to the fault dip and the soil conditions, use land more efficiently while providing equal margins of safety on both flanks.
The study addresses a well-documented gap in earthquake engineering practice. Regulatory frameworks such as California’s Alquist-Priolo Earthquake Fault Zoning Act and comparable guidelines in Utah and New Zealand rely largely on mapped rupture traces and empirical avoidance distances, while the physical-model literature has concentrated heavily on reverse faulting and on strip foundations in two dimensions. Post-earthquake reconnaissance, including investigations after the 2023 Kahramanmaraş earthquake doublets in Türkiye and earlier events such as the Wenchuan and Yushu earthquakes in China, has repeatedly shown that buildings on or near ruptured faults suffer the most severe and least repairable damage. By providing instrumented, three-dimensional evidence for rectangular foundations interacting with normal-fault ruptures in both clayey and sandy cover soils, and by converting that evidence into quantitative setback distances through a transparent multi-indicator procedure, the researchers have given geotechnical engineers and seismic hazard assessors a firmer experimental footing for one of the oldest questions in fault-zone land use: how close is too close.
Subject of Research: Physical model testing of setback distances for rectangular foundations subjected to earthquake-induced normal-fault surface rupture
Article Title: Setback distances for rectangular foundations subjected to earthquake-induced normal-fault surface rupture: 1 g physical model tests
Article References: Ma, J., Zhang, J., Li, P., Zhang, H., Chen, Y., Wang, T., Chen, H., & Nian, T. (2026). Setback distances for rectangular foundations subjected to earthquake-induced normal-fault surface rupture: 1 g physical model tests. Bulletin of Earthquake Engineering. https://doi.org/10.1007/s10518-026-02656-w
Image Credits: AI Generated
DOI: 10.1007/s10518-026-02656-w
Keywords: normal fault, surface rupture, setback distance, rectangular foundation, physical model tests, overburden soil, fault dip, ground deformation, geotechnical engineering, earthquake hazard, hanging wall, shallow foundation
Cite Scienmag News
Violet Maxwell. (October 5, 2026). Lab Models Reveal How Far Buildings Should Stand Back from Normal Faults. Scienmag. https://scienmag.com/lab-models-reveal-how-far-buildings-should-stand-back-from-normal-faults/
Violet Maxwell. "Lab Models Reveal How Far Buildings Should Stand Back from Normal Faults." Scienmag, 5 October 2026, https://scienmag.com/lab-models-reveal-how-far-buildings-should-stand-back-from-normal-faults/. Accessed 5 October 2026.
Violet Maxwell. "Lab Models Reveal How Far Buildings Should Stand Back from Normal Faults." Scienmag. October 5, 2026. https://scienmag.com/lab-models-reveal-how-far-buildings-should-stand-back-from-normal-faults/


