


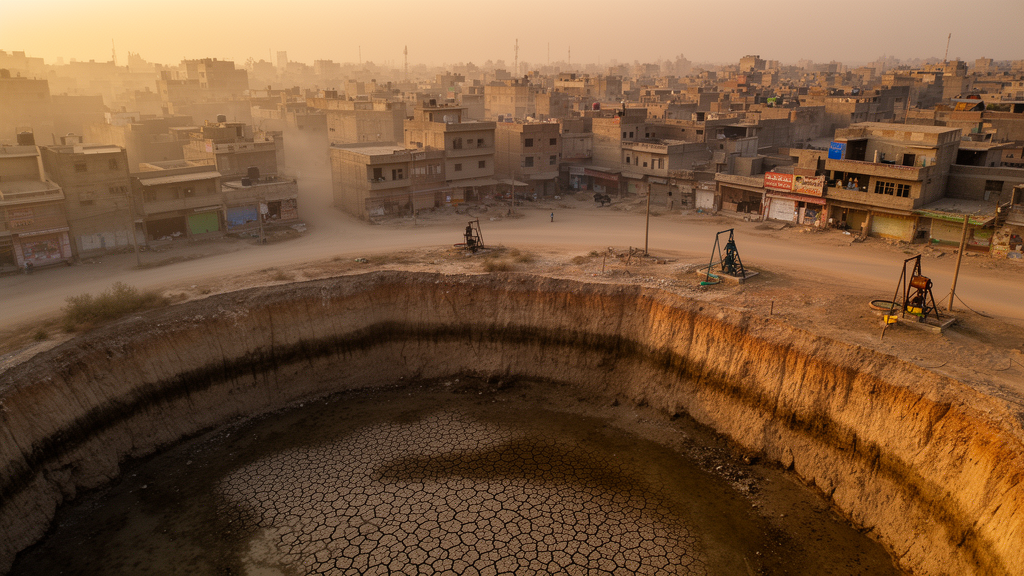
Beneath the flat, sun-baked alluvial plain of Multan in southern Punjab, Pakistan, the water table is quietly dropping, and a new study suggests the story is far stranger and more spatially patchy than a simple tale of thirsty cities draining the aquifer. A research team led by Arif Ullah of the China Institute of Water Resources and Hydropower Research, publishing in the journal Environmental Earth Sciences, has mapped groundwater-depth changes across 39 monitoring wells in Multan District between 2005 and 2018, and then tested whether urban expansion, watershed runoff potential, or regional climate shifts could explain what they saw. The answer, in short, is that none of these surface indicators could independently account for the dramatic and uneven declines they documented, a finding that carries sobering implications for how water managers across the semi-arid Indus Basin judge stress on their aquifers.
The scale of the decline in some areas is striking. The team divided the district into four watershed groups using a 30-meter digital elevation model and the HydroBASINS Level-12 sub-basin topology, then summarized groundwater observations from wells measured before and after the monsoon in 2005, 2010, 2015, and 2018. In the first watershed group, the mean increase in groundwater depth over the 13-year period was 19.32 meters, and all seven monitored wells in that group showed the water table falling, with individual changes ranging from 5.25 to 31.26 meters. The 95 percent confidence interval around that group mean, from 9.11 to 29.54 meters, was the only one of the four groups that excluded zero, making Group 1 the clearest and most statistically robust hotspot of decline. Group 4 followed with a mean increase of 15.69 meters, but its wells told wildly different stories, ranging from a 29.50-meter shallowing to a 52.42-meter deepening, the widest spread of any group.
What makes these numbers genuinely puzzling is that the most urbanized watershed was not the one sinking fastest. Group 2, which had the highest urban fraction in every mapped year, rising from 20.54 percent of its area in 2010 to 27.32 percent in 2020, recorded a mean groundwater-depth increase of only 7.21 meters. Group 1, by contrast, saw its urban fraction climb from just 3.64 percent to 10.56 percent, yet it suffered the steepest decline. Group 3, with the lowest mean change at 5.76 meters, contained wells that both deepened by more than 40 meters and shallowed by more than 24 meters. The researchers deliberately refrained from running correlations or regressions on these four group-level values, arguing that with so few units, any statistical test would be misleading. Instead, they describe the patterns as non-monotonic: urbanization and groundwater decline co-occur in some places and diverge in others.
To probe whether changing land surfaces might still be shifting the hydrology, the team turned to the Curve Number method, a standard engineering framework that combines land-cover classes with Hydrologic Soil Groups to estimate how much rainfall becomes direct runoff in a storm. Soil data from SoilGrids at 250-meter resolution showed that Hydrologic Soil Group D, the category with the highest runoff potential and lowest infiltration capacity, dominated all four watershed groups. That is why mean Curve Number values were uniformly high, between 89.15 and 89.94 in 2010, creeping up by only 0.24 to 0.64 points by 2020. A scenario analysis using hypothetical rainfall events of 10, 25, 50, and 100 millimeters showed that these small Curve Number shifts would translate into only modest increases in modeled runoff, at most 1.56 millimeters for a 100-millimeter storm. In other words, the land surface became slightly more runoff-prone as cities grew, but not enough to constitute a major hydrological upheaval.
Climate, the other obvious suspect, also failed to provide a clean explanation. Drawing on NASA POWER gridded reanalysis data from 2003 to 2018, quality-controlled down to 204,540 complete daily records across 35 meteorological grid cells, the researchers found that mean annual precipitation varied only modestly among the watershed groups, from 166.4 to 195.2 millimeters, with a spatial coefficient of variation of just 7.7 percent. Group 1 was actually the wettest group and had the lowest estimated reference evapotranspiration, yet it experienced the deepest groundwater decline. Mann-Kendall trend tests found no statistically significant monotonic trends in annual precipitation, monsoon rainfall, mean temperature, or Hargreaves reference evapotranspiration over the 16-year record. The climatic water balance, precipitation minus reference evapotranspiration, was deeply negative in every year and every group, averaging minus 1,744.2 millimeters per year, a stark reminder of how far atmospheric demand exceeds rainfall in this hot desert climate.
The drought record added further nuance. The 12-month Standardized Precipitation Index, computed relative to the study period rather than a long-term baseline, flagged 2003 as moderately dry and 2018, the final monitoring year, as severely dry, with December values of minus 1.46 and minus 1.55 respectively, while 2015 was extremely wet at plus 2.76. Yet groundwater depth generally increased across the monitoring period despite these alternating wet and dry phases. Exploratory correlations between district-mean groundwater depth and antecedent 90-, 180-, and 365-day precipitation, as well as the previous month’s SPI-12, were all negative, hinting that wetter conditions coincided with shallower water tables, but none reached statistical significance. With only eight intermittent groundwater snapshots, the authors caution, such relationships cannot be pushed toward causal interpretation.
This is precisely where the study’s intellectual honesty becomes its most valuable feature. The authors are explicit that their analysis does not simulate groundwater flow, calibrate a water balance, or attribute the observed declines to any single mechanism. Pumping rates, canal seepage, irrigation return flows, aquifer transmissivity, well-screen depths, hydraulic gradients, and river-aquifer exchange were not consistently available across the district, and without them, the spatial associations remain descriptive. The Indus Basin Irrigation System is a labyrinth of conjunctive water use; the larger Lower Bari Doab system alone carries roughly 201 kilometers of main canals, 95 kilometers of link canals, 2,264 kilometers of distributaries, and more than 60,000 tubewells in freshwater areas. Canal leakage and recirculated irrigation water can contribute substantially to aquifer replenishment, meaning that recharge in this landscape is engineered as much as natural, and it can vary dramatically over short distances.
The satellite era has only sharpened the urgency of understanding these local dynamics. Gravity-recovery missions have identified significant terrestrial water-storage losses in the Indus Basin since the mid-2010s, and global assessments have documented rapid groundwater declines, with occasional recovery, in dry regions dominated by irrigated agriculture, from the North China Plain to the US High Plains and the Central Valley. A recent national-scale analysis in Pakistan found regionally heterogeneous groundwater responses to land-use transitions, reinforcing the message that similar surface transformations do not produce uniform subsurface consequences. The Multan study adds a district-level, well-by-well texture to that picture, showing that even within a single administrative area, the mismatch between land-surface indicators and aquifer response can be profound, and that Global Moran’s I tests found no statistically significant district-wide spatial clustering of well-level declines under a four-nearest-neighbor weighting scheme.
The practical payoff is a screening framework rather than a verdict. Group 1 emerges as the unambiguous management priority, with every monitored well declining and a confidence interval that excludes zero, while Group 4 demands attention for its high mean decline and extreme well-to-well variability, and Groups 2 and 3 require finer-scale investigation before uniform measures are imposed. The authors recommend denser monitoring networks with continuous water-level loggers, measurements referenced to a common elevation datum, pumping inventories, canal-delivery and seepage records, aquifer tests, and eventually calibrated groundwater-flow or integrated surface-water-groundwater models. Their broader warning deserves to travel well beyond Punjab: urban fraction and Curve Number alone should never be used to infer groundwater decline. In data-scarce semi-arid plains around the world, organizing whatever observations exist within common hydrological units is a sensible first step, but causal stories about dying aquifers must wait for the pumping, recharge, and subsurface measurements that reveal what is really happening underground.
Subject of Research: Spatial associations between urbanization, runoff potential, and groundwater-depth change in the semi-arid alluvial plain of Multan, Pakistan
Article Title: Spatial associations between urbanization, watershed runoff potential, and groundwater-depth change in a Semi-Arid Alluvial Plain, Multan, Pakistan
Article References: Ullah, A., Wang, Y., Wang, H., liu, J., Sajjad, M. M., Hussain, I., Abbas, H., & Nazim, H. (2026). Spatial associations between urbanization, watershed runoff potential, and groundwater-depth change in a Semi-Arid Alluvial Plain, Multan, Pakistan. Environmental Earth Sciences, 85(16), Article 419. https://doi.org/10.1007/s12665-026-13164-0
Image Credits: AI Generated
DOI: 10.1007/s12665-026-13164-0
Keywords: groundwater, urbanization, Multan, Indus Basin, Curve Number, Hydrologic Soil Groups, NASA POWER, watershed delineation, semi-arid climate, land-use change, water-table decline, hydrogeology
Cite Scienmag News
Violet Maxwell. (October 8, 2026). Groundwater Is Sinking Beneath a Pakistani City, and the Usual Suspects Don’t Fully Explain It. Scienmag. https://scienmag.com/groundwater-is-sinking-beneath-a-pakistani-city-and-the-usual-suspects-dont-fully-explain-it/
Violet Maxwell. "Groundwater Is Sinking Beneath a Pakistani City, and the Usual Suspects Don’t Fully Explain It." Scienmag, 8 October 2026, https://scienmag.com/groundwater-is-sinking-beneath-a-pakistani-city-and-the-usual-suspects-dont-fully-explain-it/. Accessed 8 October 2026.
Violet Maxwell. "Groundwater Is Sinking Beneath a Pakistani City, and the Usual Suspects Don’t Fully Explain It." Scienmag. October 8, 2026. https://scienmag.com/groundwater-is-sinking-beneath-a-pakistani-city-and-the-usual-suspects-dont-fully-explain-it/


