


Researchers have unveiled a new 30 m resolution map of aboveground forest biomass covering four provinces of Southwest China, built by training a deep learning model on sub-meter satellite imagery and national forest inventory plots. The dataset, called FineKarstAGB, provides estimates for 2024 across Yunnan, Guizhou, Guangxi and Hunan, a region that has become one of the world’s most important carbon stocks thanks to decades of large-scale ecological restoration. According to the study published in Earth System Science Data, the new map achieved a coefficient of determination of 0.69 and a root mean square error of 28.51 Mg per hectare against independent inventory plots, while existing global and national biomass products showed little correlation with the same ground data, with R2 values of 0.12 or lower.
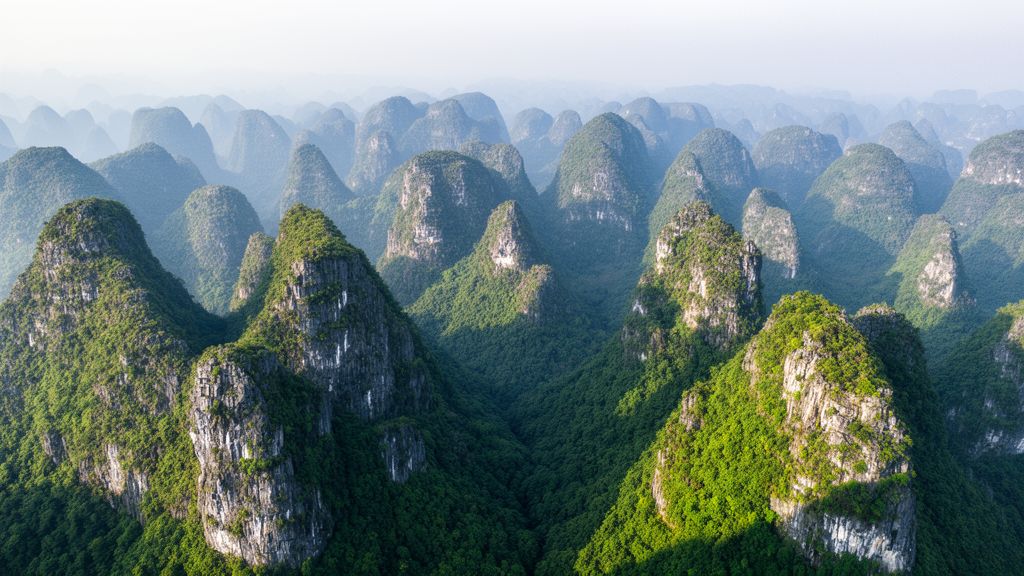
The region presents one of the hardest mapping problems in forest remote sensing. Southwest China hosts the world’s largest contiguous distribution of carbonate rocks, and its karst terrain of peak-cluster depressions, trough valleys and fragmented hills breaks vegetation into a patchwork of forest-grassland mosaics, agroforestry plots and forest-shrubland systems. Decades of state-led programs, including the Natural Forest Protection Program, the Grain for Green Program and integrated rocky desertification management, have converted farmland to forest in patterns that differ from field to field. Medium- and low-resolution satellite pixels frequently mix trees, bare rock and soil, and the resulting mixed-pixel effects are a key reason existing biomass products struggle here.
To overcome this, the team, led by researchers at the Aerospace Information Research Institute of the Chinese Academy of Sciences together with colleagues in Denmark and at the Institute of Subtropical Agriculture, developed a Canopy Structure-driven Multi-feature Fusion Network, or CSMF-Net. The model takes three spatially aligned inputs for each inventory plot patch: sub-meter optical imagery from the GaoFen-2 and GaoFen-7 satellites, a tree crown segmentation layer describing the horizontal arrangement of individual crowns, and a canopy height layer describing vertical structure. Each input passes through its own encoder branch, and a Multi-feature Cross-Attention module lets the imagery features interact with the structural features before a regression head predicts a single plot-level biomass value together with an estimate of its uncertainty.
The underlying data are substantial. The image collection comprises 10,330 GaoFen-2 scenes and 1,299 GaoFen-7 scenes acquired during 2023 and 2024, with summer 2024 imagery as the primary source and 2023 imagery filling gaps. After dehazing, geometric and radiometric correction, pan-sharpening, cloud detection and mosaicking, the processed mosaic consists of 13,648 image tiles covering the entire four-province area. The tree crown segmentation, extended from previous tree-mapping work, maps more than 21 billion individual trees across the study area, retaining crowns of at least 0.64 square meters, the equivalent of one original GaoFen pixel. Against 919 independent image-interpretation plots in which 9,061 crowns were manually delineated, the segmentation reached a precision of 0.832, a recall of 0.853 and an F1 score of 0.843.
Canopy height proved to be the single most valuable input. In leave-one-input-out ablation experiments, removing the canopy height layer degraded performance the most, raising the root mean square error by 41.2 percent and the mean absolute error by 42.7 percent relative to the full model. Dropping the crown segmentation raised those errors by 27.0 and 28.8 percent respectively, and dropping the imagery by 9.8 and 10.7 percent. The canopy height dataset itself, generated with a U-Net model trained against airborne LiDAR references, achieved a mean absolute error of 1.94 m and a root mean square error of 2.76 m on independent validation, substantially lower than several existing canopy height products, and 1.50 m and 2.82 m respectively against independent UAV LiDAR data.
Ground truth came from China’s ninth National Forest Inventory, whose fixed plots are surveyed at five-year intervals and whose plot-level biomass is derived from measured stand volume using tree-species and age-class biomass expansion factors. Because the inventory data span 2014 to 2018 while the imagery is from 2023 and 2024, the team applied an automated consistency screening workflow. A Random Forest model built on three remotely sensed features, mean NDVI, crown coverage and mean canopy height, was run with five-fold cross-validation, and plots whose out-of-fold prediction differed from the recorded inventory biomass by more than 50 percent were excluded. The final set of 3,637 plots was split into 2,545 for training, 364 for validation and 728 for testing. The authors stress that this was quality control rather than a temporal correction, and a separate analysis of 2,235 plots matched between the eighth and ninth inventories found that 82.9 percent showed stable biomass trajectories, while a scenario-based growth-slowdown analysis suggested remaining temporal uncertainty on the order of 13.45 to 20.23 Mg per hectare over assumed intervals of six to ten years.
The comparison with existing products is stark. Evaluated against the same independent inventory plots, the Yang map achieved an R2 of 0.12, the Yan map 0.04, the ESA CCI biomass product 0.06 and the Cai map 0.03, with root mean square errors ranging from 51.16 to 72.25 Mg per hectare and fitted slopes of only 0.13 to 0.32, indicating saturation and substantial underestimation in high-biomass regions. CSMF-Net, by contrast, showed no evidence of saturation: in areas with biomass above 200 Mg per hectare, its median prediction of roughly 190 Mg per hectare was 50 to 60 Mg per hectare higher than conventional products, and at biomass levels of 50 to 100 Mg per hectare it kept interquartile ranges below 25 Mg per hectare, suppressing the noise seen in products such as ESA CCI, whose interquartile ranges reached about 90 Mg per hectare.
An independent structural check using UAV LiDAR data collected in 2020 over roughly 1,208 hectares in Guilin, Fangchenggang and Wuzhou, with point densities exceeding 10 points per square meter, confirmed that the new map tracks real forest architecture. Across 3,591 forest validation samples, FineKarstAGB showed a strong relationship with LiDAR-derived mean canopy height, with an R2 of 0.54 and predicted biomass increasing monotonically across the full height spectrum, including above 20 m. The comparison products showed R2 values below 0.1, with the ESA CCI product essentially uncorrelated at the plot scale, likely reflecting its 100 m resolution. Notably, the new dataset also extends beyond closed forests: across 391 non-forest samples, it maintained a significant positive relationship with canopy height, with an R2 of 0.22, whereas the only comparable product showed a weak negative relationship with an R2 of 0.02. Because the map is built from tree-level segmentation, it quantifies biomass from sparse trees outside forests, including street and park trees in cities and scattered farmland trees that conventional forest-masked products ignore.
The resulting spatial picture matches the region’s ecology and restoration history. The four-province mean biomass is 88.22 Mg per hectare, with Yunnan highest at 95.32 Mg per hectare, closely matching the independent reference value of 95.92 Mg per hectare derived from provincial forest survey statistics, and Guizhou lowest at 81.59 Mg per hectare. High biomass concentrates in western and southern Yunnan, southeastern Guizhou, northern Guangxi and western Hunan, corresponding to rugged mountain terrain with mature natural forests, while low values appear in agroforestry ecotones, peri-urban zones and recent logging sites. Pixel-level statistics show 64.6 percent of the area in the 50 to 100 Mg per hectare range, consistent with young to middle-aged fast-growing forests shaped by active restoration, and 20.1 percent in the 100 to 150 Mg per hectare range. The map also carries pixel-level uncertainty estimates, with a mean of 9.27 Mg per hectare, a median of 8.18 Mg per hectare, and more than 90 percent of pixels between 5 and 15 Mg per hectare.
The authors note limitations that readers should keep in mind. The temporal gap between inventory plots and imagery cannot be fully eliminated, crown segmentation can merge adjacent crowns in dense forests, residual cloud contamination excluded some small areas, and residual scene-to-scene discontinuities in the mosaic may propagate into local estimates and should not be read as abrupt ecological changes. Acquiring wall-to-wall sub-meter imagery over such a large, cloudy, mountainous region also remains costly, making national or long-term monitoring extensions an open challenge. Still, the team positions FineKarstAGB as a benchmark for regional carbon cycle assessment, a tool for evaluating restoration programs such as Grain for Green and karst rocky desertification control at fine scale, and a data foundation for China’s carbon neutrality goals. The dataset is publicly available through the Science Data Bank repository.
Subject of Research: A 30 m resolution satellite-derived aboveground forest biomass dataset for Southwest China's karst region
Article Title: FineKarstAGB: a 30 m resolution aboveground biomass dataset for Southwest China derived by upscaling plot-level inventory using sub-meter GaoFen satellite data
Article References: Li, Y., Bai, Y., Chen, Z., Liu, C., Yang, X., Tong, X., Brandt, M., Wu, Z., Wang, Z., Gao, H., Wang, X., Li, S., Xu, X., & Liu, S. (2026). FineKarstAGB: a 30 m resolution aboveground biomass dataset for Southwest China derived by upscaling plot-level inventory using sub-meter GaoFen satellite data. Earth System Science Data, 18(10), 7719-7742. https://doi.org/10.5194/essd-18-7719-2026
Image Credits: AI Generated
DOI: 10.5194/essd-18-7719-2026
Keywords: aboveground biomass, karst, Southwest China, remote sensing, deep learning, GaoFen satellites, canopy height, tree crown segmentation, carbon stocks, ecological restoration, National Forest Inventory, UAV LiDAR
Cite Scienmag News
Blake Davidson. (October 26, 2026). Deep-learning map charts forest carbon across China’s karst landscapes at 30 m resolution. Scienmag. https://scienmag.com/deep-learning-map-charts-forest-carbon-across-chinas-karst-landscapes-at-30-m-resolution/
Blake Davidson. "Deep-learning map charts forest carbon across China’s karst landscapes at 30 m resolution." Scienmag, 26 October 2026, https://scienmag.com/deep-learning-map-charts-forest-carbon-across-chinas-karst-landscapes-at-30-m-resolution/. Accessed 26 October 2026.
Blake Davidson. "Deep-learning map charts forest carbon across China’s karst landscapes at 30 m resolution." Scienmag. October 26, 2026. https://scienmag.com/deep-learning-map-charts-forest-carbon-across-chinas-karst-landscapes-at-30-m-resolution/


