


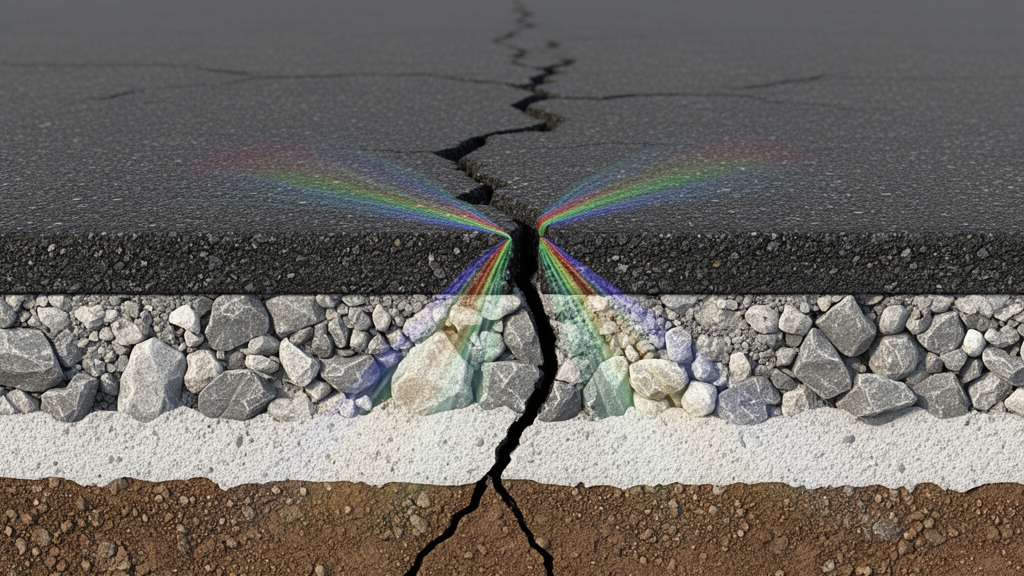
A three-dimensional finite-element analysis of semi-rigid base asphalt pavements found that the position and depth of a crack can reverse the direction of its normal stress response, alter its mixed-mode deformation pattern, and change how it responds to base stiffness. Researchers modeled six predefined semi-elliptical cracks within a four-layer pavement: three extending downward from the asphalt surface and three extending upward from the bottom of an inorganic-binder-stabilized base. Under a simulated moving dual-wheel load, corresponding cracks at the same in-plane position did not behave alike. Surface crack C1 had a tensile opening tendency while the aligned base-bottom crack C11 showed a compressive closure tendency. C2 and C3 reversed that pattern, with compressive closure tendencies at the surface and tensile opening responses at the base bottom.
The investigation used a pavement comprising a 150 mm asphalt surface course, a 350 mm stabilized base, a 150 mm granular subbase, and a 500 mm soil subgrade. The model was 6 m long and 4 m wide. All layers were treated as homogeneous, isotropic, linear-elastic materials, with the asphalt modulus set to 1400 MPa and interpreted as a 20 °C reference value. The base modulus was varied from 1100 to 1600 MPa, while the remaining material properties were held constant. A moving wheel was represented by 15 successive static pressure positions at 0.40 m intervals, using a 0.7 MPa contact pressure, a 213 mm equivalent circular tire diameter, and 319.5 mm spacing between the two tires.
Each crack had a baseline depth of 30 mm and a transverse half-length of 25 mm, giving a 50 mm full transverse length and an aspect ratio of 1.2. The study extracted three stress-intensity factors along the crack front: Mode I, representing opening or normal response; Mode II, representing in-plane sliding; and Mode III, representing out-of-plane tearing. It also calculated the J-integral as an energy-based measure of the combined crack-tip field. These quantities describe the mechanical state of prescribed initial cracks, not observed or simulated crack extension. Because opposing crack-face contact nodes were not activated, a negative Mode I value was interpreted as a compressive closure tendency rather than a contact-resolved closed crack.
The mixed-mode response depended strongly on in-plane location. At the 1400 MPa baseline, the normal component accounted for 92.45% to 99.99% of the total normalized squared stress-intensity intensity. The sign of that component was nevertheless decisive: C1, C22, and C33 had tensile opening tendencies, whereas C2, C3, and C11 had compressive closure tendencies. Surface crack C3 had the largest combined contribution from shear and tearing, with Mode II and Mode III shares of 5.31% and 2.23%. Base-bottom crack C33 followed, at 3.30% and 1.73%. These normalized values describe relative modal intensity and are not separate energy-release fractions.
Base stiffness did not produce a single trend across the pavement. From 1100 to 1600 MPa, the peak J-integral changed by 1.4% for C1, decreased by 38.9% for C2, and increased by 13.6% for C3. The direction reversed among surface-crack positions, demonstrating that the effect of stiffness cannot be represented by one multiplier applied everywhere. For the base-bottom cracks, the peak J-integral increased by 18.8% for C11, 22.9% for C22, and 30.0% for C33 as base modulus rose. C22 consistently had the largest J-integral among these three locations, rising from about 0.0847 J/m² to 0.1041 J/m².
Sensitivity tests showed that assumptions about crack shape and interlayer bonding could alter the response as much as, or more than, the investigated stiffness range. Increasing the depth of representative crack C2 from 20 to 40 mm while retaining its 25 mm transverse half-length raised its peak absolute Mode I factor from 19,579 to 25,232 Pa·m^0.5, an increase of 28.9%. Its peak J-integral increased by 69.4%, from 0.25510 to 0.43213 J/m². For base-bottom crack C22, the corresponding increases were 16.8% for peak absolute Mode I and 37.1% for peak J. The sign of the normal response remained unchanged in both cases over the tested geometries.
Interlayer constraint produced the largest change in the representative comparison. In a bounding sensitivity case, the interface between the stabilized base and granular subbase was changed from fully bonded to frictionless while the other interfaces, materials, geometry, mesh, and loading remained unchanged. For C2, peak absolute Mode I increased by 70.7% and peak J rose by 191.7%. For C22, those increases reached 242.4% and 1124.3%. The frictionless interface was not calibrated to a particular field condition; it was used to test the model’s sensitivity to sliding and separation. Even so, the large response of C22 indicates that constraint at the base-subbase boundary is especially important when assessing a crack originating at the bottom of the stabilized layer.
Numerical checks supported the stability of the reported results. A three-level crack-front mesh study used 10, 15, and 20 crack-front divisions, with maximum contour radii of 4, 3, and 2 mm. Relative to the fine mesh, the baseline discretization differed by no more than 0.70% in peak J and 0.52% in peak absolute Mode I for the representative surface and base-bottom cracks. Outer domain-integral contours also converged closely, and the sixth contour was selected for reporting. A local check across loading Steps 10 through 14 found the strongest discrete response at Step 12 for both C2 and C22, although the full wheel path was not re-discretized at finer spacing and an inter-step maximum therefore could not be excluded.
The results provide a mechanical baseline, not a prediction of field failure or long-term fatigue life. The model did not include temperature-dependent asphalt viscoelasticity, thermal contraction, moisture-related shrinkage, coupled thermo-hygro-mechanical effects, evolving crack paths, or accumulated fatigue damage. It also lacked experimental or field validation, and absolute stress-intensity or J-integral magnitudes cannot directly rank risks between cracks in the asphalt surface and those in the stabilized base because the materials may have different critical fracture toughness or energy-release thresholds. Within the fixed linear-elastic state and prescribed geometry, the clearest conclusion is that crack position, structural depth, and interface condition govern the initial crack-tip response in ways that a location-independent stiffness rule would miss.
Subject of Research: Finite-element analysis of how crack position, depth, geometry, and base stiffness affect crack-tip responses in semi-rigid asphalt pavements.
Article Title: Effects of planar crack distribution insemi-rigid base asphalt pavements
Article References: Yu, L., Reheman, A., Lyu, L., Hu, D., Li, R., & Pei, J. (2026). Effects of planar crack distribution insemi-rigid base asphalt pavements. Case Studies in Construction Materials, 25, Article e06642. https://doi.org/10.1016/j.cscm.2026.e06642
Image Credits: AI Generated
DOI: 10.1016/j.cscm.2026.e06642
Keywords: asphalt pavements, semi-rigid bases, fracture mechanics, stress intensity factors, J-integral, moving loads, finite-element modeling, crack propagation, base stiffness, interlayer bonding, Effects, planar
Cite Scienmag News
Denise Maddox. (October 20, 2026). Crack Position Changes Stress Patterns in Semi-Rigid Asphalt Pavements. Scienmag. https://scienmag.com/crack-position-changes-stress-patterns-in-semi-rigid-asphalt-pavements/
Denise Maddox. "Crack Position Changes Stress Patterns in Semi-Rigid Asphalt Pavements." Scienmag, 20 October 2026, https://scienmag.com/crack-position-changes-stress-patterns-in-semi-rigid-asphalt-pavements/. Accessed 20 October 2026.
Denise Maddox. "Crack Position Changes Stress Patterns in Semi-Rigid Asphalt Pavements." Scienmag. October 20, 2026. https://scienmag.com/crack-position-changes-stress-patterns-in-semi-rigid-asphalt-pavements/


