


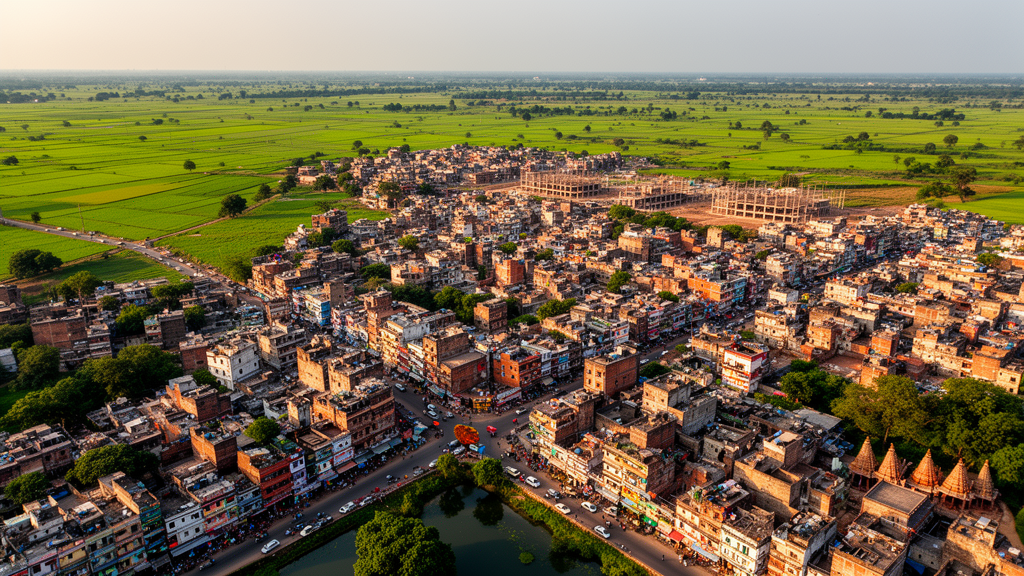
Built-up land in Cooch Behar, a small city in West Bengal, India, expanded from 2.24 square kilometres in 1990 to 6.28 square kilometres in 2022, according to a retrospective geospatial study. That is a 180.36% increase over 32 years, equivalent to a compound annual growth rate of 3.27%. The increase was geographically widespread: all 20 municipal wards recorded more built-up area in 2022 than in 1990, and also grew between the two earlier observation dates of 1990, 2006 and 2022. The researchers calculated growth from classified satellite imagery independently of the entropy measures used to describe how development was distributed.
The study used Landsat Collection 2 Level-2 surface-reflectance imagery at 30-metre resolution, with scenes from 3 March 1990 and 25 October 2006 acquired by Landsat 5 TM and a 30 November 2022 scene acquired by Landsat 9 OLI-2. Cloud and shadow flags were used to mask affected pixels, and all images were projected into the WGS 84/UTM Zone 45 N coordinate system and aligned to the same grid. A supervised maximum-likelihood classification separated built-up land, water, vegetation, agricultural land, and fallow or barren land. The researchers selected Landsat 5 for 2006 because Landsat 7 ETM+ had systematic scan-line-corrector gaps, which could have produced unequal omissions among small wards, rings and sectors.
Absolute and relative area changes identified the scale of Cooch Behar’s physical expansion. Mapped built-up area rose to 4.55 square kilometres in 2006, an increase of 2.31 square kilometres or 4.53% annually relative to 1990. It then reached 6.28 square kilometres in 2022, adding 1.73 square kilometres during the following interval. Although the absolute gain was smaller in 2006–2022 than in 1990–2006, the built-up total remained almost three times its 1990 level. The median ward gained 0.191 square kilometres across the full period, with an interquartile range of 0.115 to 0.272 square kilometres, indicating that expansion was not confined to a small number of administrative units.
Repeated-measures analysis supported the consistency of the mapped changes. A Friedman test comparing built-up area in the same 20 wards across the three dates returned a chi-square statistic of 40.0 with p below 0.001, while Kendall’s W was 1.00. Exact two-sided Wilcoxon signed-rank comparisons for all three date pairs produced Holm-adjusted p values below 0.001. These tests are within-study diagnostics because the wards are spatial units rather than a random sample, but they show that the temporal increase was consistent across the municipal area. They do not reveal whether new development took the form of infilling, outward edge expansion or disconnected leapfrog development, because the study did not apply patch-adjacency or landscape-expansion metrics.
The study’s central technical distinction is between measuring how much urban land exists and measuring how that land is distributed. Normalized Shannon entropy for built-up land was calculated from each zone’s share of the city’s total built-up area across 20 wards, six concentric 500-metre rings and eight 45-degree sectors. A value near zero indicates concentration, while a value near one indicates an even distribution. Separately, five-class land-use and land-cover entropy was used to describe the mixture of built-up, water, vegetation, agricultural and barren land within each unit. Neither form of entropy can, by itself, demonstrate urban growth: that conclusion requires an independent temporal change in total area.
Ward-level results showed that built-up land became more evenly distributed among administrative zones. Normalized built-up entropy increased from 0.9183 in 1990 to 0.9746 in 2006 and remained nearly stable at 0.9733 in 2022. The effective number of wards represented by the distribution rose from 15.66 to about 18.5, while both the Herfindahl–Hirschman Index and Gini coefficient declined. In 1990, the Gini coefficient was 0.380; it fell to 0.217 in 2006 and edged up to 0.227 in 2022. These complementary measures show less concentration across wards, not a transition to a more compact urban form. The principal 1990-to-later contrast also survived sensitivity tests in which ward areas were independently perturbed by as much as 5% and 10% across 10,000 fixed-seed simulations.
Radial analysis nevertheless showed a shift in the location of development after 2006. Normalized entropy across the six rings was 0.9434 in 1990, 0.9407 in 2006 and 0.9575 in 2022. The two outer rings, covering distances of 2,000 to 3,000 metres from the fixed city centre, together held 25.84% of built-up area in 1990 and 23.62% in 2006, but their share rose to 32.44% in 2022. Over the same period, the two innermost 500-metre rings fell from 38.05% to 22.26% of the total. These results support outward redistribution of built-up land after 2006, although they cannot determine whether the new peripheral land formed through contiguous edge growth or scattered patches. The 3,000-metre radius was an analytical boundary rather than a statutory or functional limit of the city.
Built-up land also remained broadly distributed by direction. Normalized entropy across the eight sectors stayed close to its maximum, measuring 0.9885 in 1990, 0.9848 in 2006 and 0.9892 in 2022. That near-even pattern coexisted with unequal absolute gains. The south-east recorded the largest proportional increase from 1990 to 2022, at 259.89%, followed by east at 237.36% and north at 204.47%; north contained the largest 2022 share at 17.82%. Slower south-western growth is consistent with the Torsa River bordering the city on its southern, south-western and south-eastern sides, but the analysis did not establish the river as a causal barrier. Road access, land availability, public facilities, property values and flood-prone land were also plausible influences, yet none was tested using parcel, transport, pricing or planning-permission data.
The 2022 land-cover map achieved 92.91% overall accuracy, with a Wilson 95% confidence interval of 87.44–96.10% and a kappa coefficient of 0.869. Its assessment used 141 independent reference allocations, of which 131 were correct. Built-up land had producer’s and user’s accuracies of 97.78% and 92.63%, respectively. Quantity disagreement was 4.26%, compared with allocation disagreement of 2.84%, meaning that errors affecting class totals contributed more than errors in spatial assignment. Independent validation was unavailable for the 1990 and 2006 maps, so historical change estimates remain provisional. March imagery for 1990 also differed seasonally from the October–November scenes used in the other years, creating uncertainty in transitions involving vegetation, agriculture and fallow land even though built-up land was the principal change variable.
Together, the results provide a multiscale baseline for a historically planned, river-constrained city but do not amount to a forecast or an audit of urban sustainability. Mapped built-up area increased, its distribution among wards became more even, and the outer-ring share rose after 2006, while directional dispersion remained high. The study also demonstrates why a single entropy number can be misleading: low land-cover compositional entropy can mean that one mapped class dominates a unit, not that urban growth has occurred. A formal land-consumption-to-population-growth assessment was not possible because satellite dates and census years did not align, and only three mapped epochs were available. The authors therefore call for additional validation, patch-based landscape metrics and driver data before assigning firm morphological labels or causal explanations to Cooch Behar’s changing development pattern.
Subject of Research: Remote-sensing analysis of urban growth and built-up land distribution in Cooch Behar, India, from 1990 to 2022.
Article Title: Assessing urban growth dynamics in Cooch Behar city using the Shannon entropy model
Article References: Hossain, S., Alam, M. K., & Islam, N. (2026). Assessing urban growth dynamics in Cooch Behar city using the Shannon entropy model. Discover Cities, 3(1), Article 205. https://doi.org/10.1007/s44327-026-00383-0
Image Credits: AI Generated
DOI: 10.1007/s44327-026-00383-0
Keywords: urban growth, Cooch Behar, Landsat imagery, Shannon entropy, built-up land, remote sensing, land-cover change, spatial distribution, India, urban planning, Assessing, urban
Cite Scienmag News
Courtney Benton. (October 21, 2026). Cooch Behar’s built-up area expanded 180% from 1990 to 2022. Scienmag. https://scienmag.com/cooch-behars-built-up-area-expanded-180-from-1990-to-2022/
Courtney Benton. "Cooch Behar’s built-up area expanded 180% from 1990 to 2022." Scienmag, 21 October 2026, https://scienmag.com/cooch-behars-built-up-area-expanded-180-from-1990-to-2022/. Accessed 21 October 2026.
Courtney Benton. "Cooch Behar’s built-up area expanded 180% from 1990 to 2022." Scienmag. October 21, 2026. https://scienmag.com/cooch-behars-built-up-area-expanded-180-from-1990-to-2022/


