


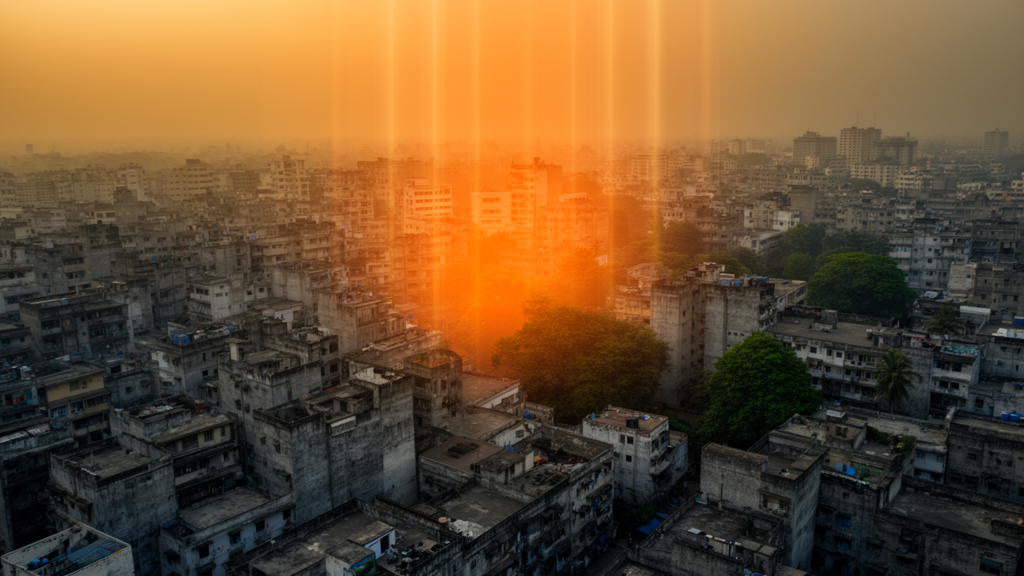
Chennai, one of India’s fastest-growing coastal metropolises, has been quietly cooking itself for more than two decades, and a new study has now put hard numbers on the transformation. Researchers at the National Institute of Technology Tiruchirappalli reconstructed the city’s urban heat island history from 2001 to 2022 and found that the annual nighttime heat island intensity doubled, rising from 0.71 degrees Celsius in 2001 to 1.43 degrees Celsius in 2016. The culprit, the analysis shows, is not some abstract climatic shift but the relentless conversion of vegetated land and water bodies into concrete, asphalt, and rooftops. Built-up area in the metropolitan region expanded by a staggering 156.56 percent over the study period, growing from 205.55 square kilometers in 2001 to 526.61 square kilometers in 2022. Every square kilometer of that expansion replaced surfaces that once cooled the city through evaporation and shade with materials that absorb solar radiation all day and release it slowly through the night.
The study, published in the journal Theoretical and Applied Climatology, was led by Kajesh Gadekar and Aneesh Mathew, who combined satellite imagery, spectral indices, and machine learning into a single analytical framework. To track how the city’s surface changed, the team classified multi-temporal Landsat imagery into land use and land cover categories, revealing the steady march of construction across Chennai’s fringes. To quantify the heat island itself, they turned to nighttime land surface temperature data from the Moderate Resolution Imaging Spectroradiometer, or MODIS, instrument, which allowed them to compute annual and seasonal heat island intensities consistently across the entire two-decade window. Nighttime measurements are particularly revealing for urban climate science because that is when the thermal contrast between dense cities and their rural surroundings is most pronounced, as built-up materials continue radiating stored heat long after sunset while rural soils and vegetation cool quickly.
One of the most striking findings is seasonal. Counterintuitively, the urban heat island in Chennai was strongest in winter, not summer, peaking at 2.21 degrees Celsius in 2018. The explanation lies in the physics of the surrounding landscape. During the monsoon and post-monsoon months, rural areas around the city are moist and vegetated, so a large fraction of incoming solar energy is consumed by evapotranspiration rather than heating the ground. The city, by contrast, remains dry and impervious year-round, so its surfaces warm efficiently and hold that warmth into the night. The result is a large urban-rural temperature differential precisely when residents might least expect it. Summer heat islands, while lower in intensity, still showed significant peaks in the urban core, underscoring the role of construction materials such as concrete and bitumen in retaining heat even during the hottest months of the year.
To understand what drives these temperature patterns at the level of individual pixels, the researchers computed a suite of environmental predictors from satellite data. These included the Enhanced Vegetation Index, a measure of green biomass; the Normalized Difference Built-up Index, which flags impervious construction; the Modified Normalized Difference Water Index, which captures surface moisture and open water; the Modified Bare Soil Index, which identifies exposed earth; and Aerosol Optical Depth, a proxy for atmospheric particulate loading. They added elevation, latitude, and longitude to account for terrain and geographic position. Correlation analysis between land surface temperature and these parameters revealed a coherent physical story. Vegetation and elevation were negatively correlated with temperature, meaning greener and higher ground runs cooler. Built-up index and aerosol loading were positively correlated, confirming that denser construction and hazier air accompany hotter surfaces.
The predictive heart of the study lies in its comparison of two machine learning algorithms trained to estimate land surface temperature from those environmental predictors. The team tested Random Forest, an ensemble method that averages the outputs of many decision trees, against Extreme Gradient Boosting, known as XGBoost, which builds trees sequentially so that each new one corrects the errors of its predecessors. XGBoost emerged as the clear winner, achieving a testing coefficient of determination of 0.8417, meaning it explained more than 84 percent of the variance in observed temperatures. Its error metrics were correspondingly tight, with a mean absolute error of 0.5796 degrees Celsius, a mean squared error of 0.4275 degrees Celsius squared, and a root mean squared error of 0.6538 degrees Celsius. Random Forest performed respectably but trailed on every metric, and the gap confirms that gradient boosting’s iterative error correction is particularly well suited to the nonlinear relationships linking land cover, moisture, aerosols, and surface temperature.
The seasonal breakdown of model performance adds further confidence. XGBoost achieved its highest coefficient of determination in winter, at 0.8805, and a strong 0.799 in summer, with error metrics remaining within acceptable ranges in both seasons. That robustness matters because a model that only works in one season would be of limited use for city planners trying to anticipate thermal stress throughout the year. Spatial validation reinforced the picture: predicted temperatures deviated minimally from observations, especially in dense urban areas where the Enhanced Vegetation Index remains relatively stable and the thermal signal is dominated by built surfaces. In rural zones, prediction errors were larger, a consequence of dynamic vegetation phenology and more varied terrain, where crop cycles and soil moisture swings introduce variability that static predictors struggle to capture.
What makes this study resonate far beyond Chennai is its methodological template. By fusing remote sensing, geospatial analysis, and machine learning into a single pipeline, the researchers demonstrated a repeatable way to diagnose how land cover transformation reshapes a city’s thermal climate. The approach requires no dense network of ground weather stations, which many rapidly urbanizing cities in the Global South lack. Instead, freely available satellite data from Landsat and MODIS, combined with open-source machine learning tools, can produce spatially explicit temperature maps and intensity estimates at annual and seasonal resolution. For the dozens of coastal megacities expected to absorb enormous population growth in the coming decades, that is a powerful and accessible diagnostic instrument.
The implications for planning are concrete. The study’s findings provide quantitative evidence for prioritizing vegetation conservation, blue-green infrastructure, and thermally sensitive land-use planning in rapidly urbanizing coastal cities. In practice, that means protecting remaining green corridors and wetlands before they are paved, integrating parks, lakes, and vegetated buffers into new development, and treating surface materials as a design variable rather than an afterthought. Because the analysis shows vegetation-related indicators contribute directly to cooling while built-up expansion intensifies the heat island, the model can be used prospectively: planners can simulate how a proposed land use scenario would alter surface temperatures before a single foundation is poured. The XGBoost model’s accuracy makes such scenario testing credible at the neighborhood scale.
Chennai’s two-decade record is, in effect, a controlled experiment in what happens when a humid coastal city converts its cooling infrastructure into heat-storing mass. The doubling of annual heat island intensity, the winter peaks above two degrees Celsius, and the near-tripling of built-up area together trace a clear causal chain from land use decision to thermal outcome. As climate change raises baseline temperatures across South Asia, the additional heat generated by urban form will compound the burden on residents, particularly those in dense, low-income neighborhoods with little tree cover. Studies of this kind turn that burden from an invisible background condition into a measurable, modelable, and therefore manageable quantity. The heat island, the research makes clear, is not an inevitable byproduct of urban growth. It is the predictable consequence of specific land cover choices, and it can be reversed the same way it was created, one surface at a time.
Subject of Research: Urban heat island dynamics, land use change, and machine learning-based land surface temperature prediction in Chennai, India
Article Title: Spatiotemporal Dynamics of Urban Heat Islands in Chennai: A Two-Decade Study on Land Use Changes and Predictive Modeling
Article References: Gadekar, K., & Mathew, A. (2026). Spatiotemporal Dynamics of Urban Heat Islands in Chennai: A Two-Decade Study on Land Use Changes and Predictive Modeling. Theoretical and Applied Climatology, 157(10), Article 611. https://doi.org/10.1007/s00704-026-06496-1
Image Credits: AI Generated
DOI: 10.1007/s00704-026-06496-1
Keywords: urban heat island, Chennai, land surface temperature, land use land cover change, XGBoost, Random Forest, MODIS, Landsat, remote sensing, machine learning, urbanization, blue-green infrastructure
Cite Scienmag News
Violet Maxwell. (October 8, 2026). Chennai’s Heat Island Doubled in Fifteen Years as Concrete Swallowed Green Space. Scienmag. https://scienmag.com/chennais-heat-island-doubled-in-fifteen-years-as-concrete-swallowed-green-space/
Violet Maxwell. "Chennai’s Heat Island Doubled in Fifteen Years as Concrete Swallowed Green Space." Scienmag, 8 October 2026, https://scienmag.com/chennais-heat-island-doubled-in-fifteen-years-as-concrete-swallowed-green-space/. Accessed 8 October 2026.
Violet Maxwell. "Chennai’s Heat Island Doubled in Fifteen Years as Concrete Swallowed Green Space." Scienmag. October 8, 2026. https://scienmag.com/chennais-heat-island-doubled-in-fifteen-years-as-concrete-swallowed-green-space/


