One of the most stubborn problems in psychiatry is telling bipolar disorder apart from major depressive disorder when the patient arrives in a depressive episode. The symptoms overlap almost completely: low mood, loss of interest, fatigue, disrupted sleep. Yet the treatments diverge sharply, and prescribing antidepressants alone to someone with unrecognized bipolar disorder can trigger manic switches or destabilize the illness. A new multimodal neuroimaging study, published in BMC Psychiatry, now offers a strikingly clear biological contrast between the two conditions, one that may eventually help clinicians distinguish them with objective brain-based markers rather than symptom checklists alone.
A team led by Hui Yuan, Haishan Wu, and Wenbin Guo at the Second Xiangya Hospital of Central South University, working with collaborators across several Chinese hospitals, enrolled 315 treatment-naïve participants: 94 people with depressed bipolar disorder, 94 with major depressive disorder, and 127 healthy controls. Restricting the sample to individuals who had not yet received psychiatric medication was a deliberate design choice, because drugs such as antidepressants and mood stabilizers can themselves reshape brain connectivity and confound group comparisons. All participants underwent resting-state functional magnetic resonance imaging, in which spontaneous blood-oxygen-level-dependent fluctuations are recorded while the subject simply lies still, allowing researchers to map the brain’s intrinsic functional architecture.
The imaging analysis rested on the Dosenbach 160-node functional atlas, a parcellation that divides the cortex and subcortex into 160 regions of interest grouped into canonical networks. Using the DPABI toolbox, the researchers computed static functional connectivity, a measure of how tightly the activity of two brain regions is synchronized over the entire scan. They then went a step further with dynamic functional connectivity, applying a sliding-window approach implemented in the DynamicBC toolbox. This technique slices the resting-state time series into short overlapping segments and computes connectivity within each, revealing how the brain’s coordination patterns fluctuate from moment to moment rather than assuming a single fixed configuration across the whole session.
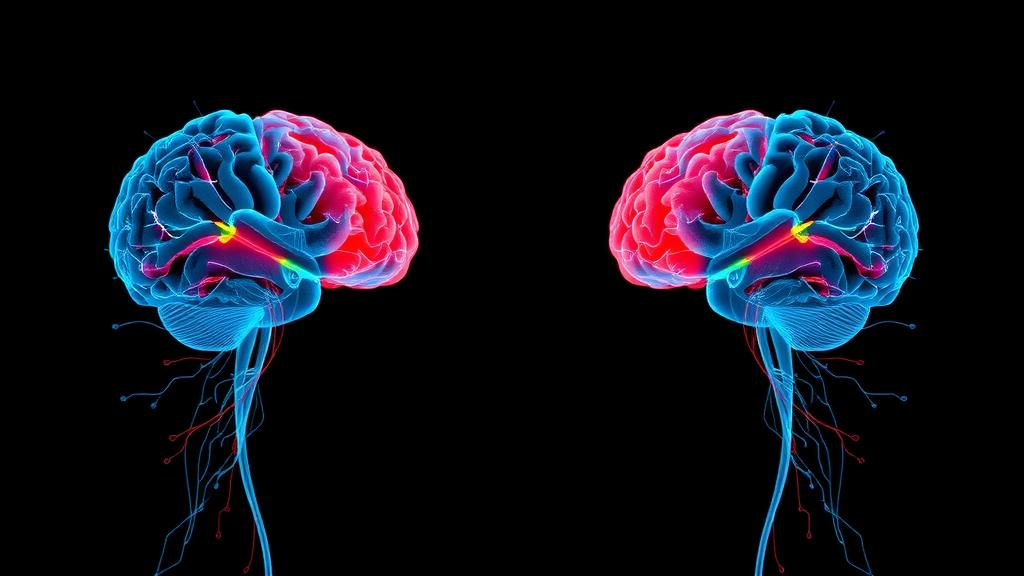
The static results were the study’s headline finding, and they point in opposite directions for the two disorders. Patients with depressed bipolar disorder showed heightened connectivity within four major networks: the default mode network, the frontoparietal network, the sensorimotor network, and the ventral attention network. Patients with major depressive disorder showed the reverse pattern, with reduced connectivity within these same networks. The default mode network, active during self-referential thought and rumination, and the frontoparietal network, which supports cognitive control and emotion regulation, have both been repeatedly implicated in mood disorders. But the fact that the same networks show increased internal synchronization in one illness and decreased synchronization in the other is what makes the finding biologically interesting rather than merely confirmatory.
This directional contrast suggests that the two conditions, despite their surface similarity, arise from distinct pathophysiological mechanisms rather than a single continuum of depression. In bipolar depression, exaggerated coupling within these networks may reflect a hyperconnected intrinsic state, potentially related to the emotional intensity and cognitive inflexibility characteristic of the illness. In major depressive disorder, weakened within-network integration may correspond to the disconnection between self-referential processing and regulatory control systems that many prior studies have described. The sensorimotor and ventral attention findings add further texture, hinting that psychomotor slowing and attentional biases, both common in depressive states, are mirrored in the functional organization of motor and attention circuitry.
The dynamic analysis, by contrast, found no significant differences between the bipolar and major depression groups in how their connectivity patterns shifted over time. This null result is itself informative. It suggests that the diagnostic signal separating the two illnesses resides primarily in the stable, averaged architecture of brain networks rather than in their moment-to-moment reconfiguration. For researchers designing biomarker studies, that is a practical clue: static connectivity measures, which are simpler and more robust to compute, may carry more discriminative value than the more elaborate dynamic metrics, at least for this clinical distinction.
To probe what might drive these connectivity differences at the molecular level, the team turned to transcriptomic mapping. They linked their neuroimaging results to gene expression data from the Allen Human Brain Atlas, a publicly available resource that charts the expression of roughly 20,000 genes across the human brain. By correlating the spatial pattern of connectivity alterations with the spatial distribution of gene expression, the researchers identified genes whose regional expression profiles track the connectivity changes seen in the patient groups. Enrichment analyses pointed to genes involved in synaptic signaling and in the regulation of the MAPK cascade, a signaling pathway that participates in neuronal plasticity, stress responses, and the downstream effects of several psychotropic drugs.
The transcriptomic layer transforms the study from a descriptive imaging comparison into a hypothesis about mechanism. If the regions most affected in bipolar depression are enriched for genes governing synaptic communication and MAPK-mediated signaling, that hints at where the developmental or molecular vulnerabilities might lie. It also connects the imaging findings to a growing literature in which genome-wide association study loci for psychiatric illness are mapped onto brain gene expression to identify which cell types and circuits are most genetically implicated. The authors report that validation analyses supported the robustness of their findings, an important step given how sensitive connectivity analyses can be to preprocessing choices, motion artifacts, and multiple-comparison thresholds, which the team addressed using false discovery rate correction.
Cognitive assessments were woven into the design as well, reflecting the study’s aim of integrating neuroimaging, cognitive, and genetic evidence into a single framework. Mood disorders are not purely affective conditions; they carry measurable deficits in attention, memory, and executive function, and these deficits differ in profile between bipolar and unipolar illness. By anchoring the imaging results to cognitive performance, the researchers sought to show that the connectivity differences are not abstract statistical contrasts but correspond to differences in how patients actually think and feel. The study, in the authors’ words, offers a comprehensive exploration of intrinsic functional architecture disparities in resting-state activity between the two conditions, delving into both static and dynamic functional connectivity.
The clinical implications are tantalizing but should be tempered with caution. A single cross-sectional study, however well designed, cannot by itself become a diagnostic test. The directional contrast in within-network connectivity is a promising candidate marker, and the fact that it emerged in a treatment-naïve sample strengthens its claim to reflect illness biology rather than medication effects. But replication in independent cohorts, ideally with longitudinal follow-up to see whether connectivity patterns predict illness course or treatment response, will be essential. If the findings hold, they could pave the way toward more precise diagnosis and targeted treatment strategies, helping clinicians identify bipolar disorder earlier, spare unipolar patients unnecessary medication trials, and guide the development of interventions aimed at the specific circuits and molecular pathways that each condition disrupts. For now, the study contributes a valuable piece to the evolving puzzle of mood disorders, demonstrating that two conditions that look identical in the clinic can look like opposites in the brain.
Subject of Research: Distinguishing depressed bipolar disorder from major depressive disorder using static and dynamic functional connectivity, cognitive, and transcriptomic evidence
Article Title: Distinct static functional patterns and dynamic patterns between depressed bipolar disorder and major depressive disorder: integrating neuroimaging, cognitive, and transcriptomic evidence
Article References: Distinct static functional patterns and dynamic patterns between depressed bipolar disorder and major depressive disorder: integrating neuroimaging, cognitive, and transcriptomic evidence. (n.d.). https://doi.org/10.1186/s12888-026-08674-x
Image Credits: AI Generated
DOI: 10.1186/s12888-026-08674-x
Keywords: bipolar disorder, major depressive disorder, functional connectivity, resting-state fMRI, default mode network, frontoparietal network, transcriptomics, Allen Human Brain Atlas, MAPK cascade, synaptic signaling, psychiatry, biomarkers
Cite Scienmag News
Glenn Wilkins. (October 8, 2026). Brain Wiring Reveals Opposite Signatures in Bipolar Depression and Major Depression. Scienmag. https://scienmag.com/brain-wiring-reveals-opposite-signatures-in-bipolar-depression-and-major-depression/
Glenn Wilkins. "Brain Wiring Reveals Opposite Signatures in Bipolar Depression and Major Depression." Scienmag, 8 October 2026, https://scienmag.com/brain-wiring-reveals-opposite-signatures-in-bipolar-depression-and-major-depression/. Accessed 8 October 2026.
Glenn Wilkins. "Brain Wiring Reveals Opposite Signatures in Bipolar Depression and Major Depression." Scienmag. October 8, 2026. https://scienmag.com/brain-wiring-reveals-opposite-signatures-in-bipolar-depression-and-major-depression/