


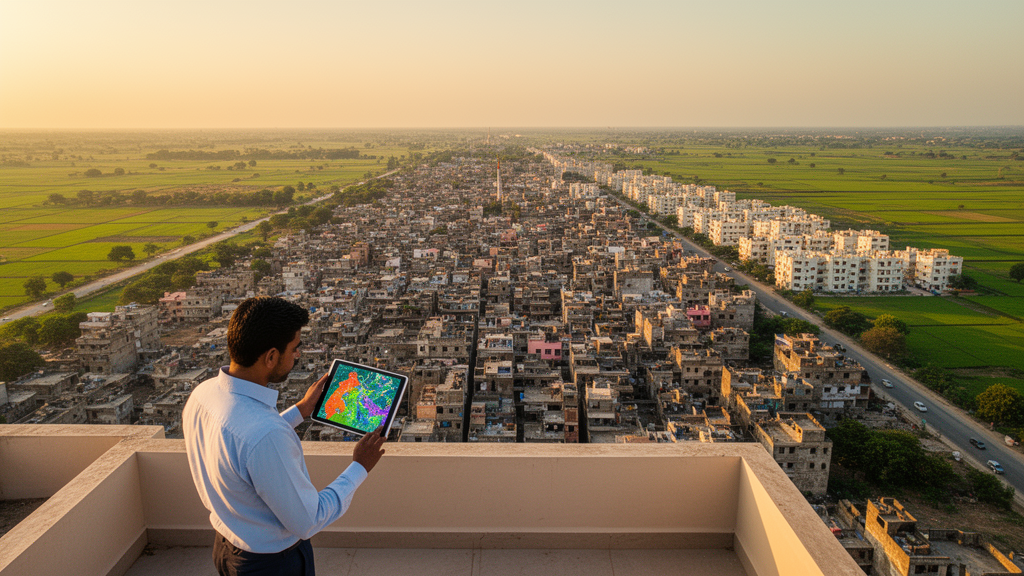
Some 70 kilometers northwest of Delhi, on the flat expanse of the Indo-Gangetic alluvial plain, a mid-sized Indian city has been quietly rewriting the rules of how secondary cities grow. Rohtak, a major urban center in Haryana and part of India’s National Capital Region, has more than quadrupled its built-up footprint in three decades, expanding from roughly 1,641 hectares in 1991 to about 6,686 hectares by 2021. A new study published in Frontiers in Remote Sensing has now traced that growth with unusual precision, using satellite imagery, landscape ecological metrics and multivariate statistics to reveal not just how much the city has grown, but how, where and in what order its expansion unfolded between 2000 and 2020.
The research, led by Bharat Bhushan and colleagues at Lovely Professional University with collaborators from Manipal University Jaipur, the University of Pécs in Hungary and Minia University in Egypt, set out to answer a question that conventional urban studies often gloss over. Most assessments of Indian cities rely on simple area statistics or single-date land-use comparisons, which can quantify the magnitude of growth but say little about its mode. The team instead applied the Landscape Expansion Index, or LEI, a metric that classifies every newly grown urban patch as infilling, edge-expansion or leapfrog development depending on its spatial relationship to pre-existing built-up land. Patches with LEI values above 50 are classified as infilling, those between 0 and 50 as edge-expansion, and those at exactly zero as leapfrog, meaning entirely disconnected new development.
To build the analysis, the researchers drew on multi-temporal Landsat 5 Thematic Mapper and Landsat 8 OLI/TIRS surface reflectance imagery for five observation years: 2000, 2005, 2010, 2015 and 2020, all acquired during the post-monsoon months of October and November to minimize atmospheric and phenological variation. The images were classified in QGIS using a supervised Minimum Distance classifier trained on 50 to 100 pixels per land-cover class, with training samples compiled from high-resolution Google Earth imagery and field observations. Accuracy assessment using 200 stratified random sample points produced overall accuracies ranging from 85.63 percent in 2000 to 92.38 percent in 2020, with kappa coefficients climbing steadily from 0.85 to 0.92, a gradual improvement the authors attribute to better sensor radiometric resolution and spectral range over the two decades.
The classified built-up layers were then interrogated through concentric distance buffers at 2, 4, 6, 8 and 10 kilometers from the city center and through eight directional wedges radiating outward. The results revealed a striking anisotropy in Rohtak’s growth. The north-western and western sectors emerged as the most aggressive fronts of expansion, with built-up area at 6 kilometers northwest increasing by 69.6 percent, from 3.03 to 5.14 square kilometers, between 2000 and 2020. At 4 kilometers north, urban area surged by an extraordinary 410 percent, from 0.65 to 3.32 square kilometers. The largest single regional increase was recorded at 8 kilometers southwest, where built-up area grew by 365 percent over the study period. By contrast, the eastern corridor remained conspicuously underdeveloped, with growth at 2 kilometers east amounting to just 1.3 percent.
The Mann-Kendall trend test combined with Sen’s slope estimator confirmed that this directional selectivity is statistically robust rather than a product of noise. At the innermost 2-kilometer radius, significant increasing trends appeared in the northeast, north, northwest, southwest, south and southeast sectors, with the steepest rates northward at 0.034 square kilometers per year, while the pure east and west sectors failed to reach significance. From 4 kilometers outward, every sector exhibited a statistically significant increasing trend, with the highest single slope recorded in the northern sector at 4 kilometers, at 0.127 square kilometers per year, followed by the eastern sector at 6 kilometers at 0.135 square kilometers per year. Beyond 6 kilometers the rates moderated but remained positive and significant, indicating that expansion continues into the outer annuli at a slower absolute pace.
The distance-gradient analysis produced one of the study’s most consequential findings: a clear concentric structure in the mode of expansion. At 2 kilometers from the core, growth was classified almost entirely as infilling, with LEI values ranging from 46.17 to 99.80, and edge-expansion dropping to zero after 2005, confirming that the saturated core is filling in its last vacant gaps rather than adding new territory. At 4 kilometers the picture was transitional, with infilling predominating in the northwest and west while edge-expansion dominated elsewhere. Beyond 4 kilometers, infilling disappeared completely; all expansion at 6, 8 and 10 kilometers was edge-expansion, with the 6-kilometer ring consistently contributing the largest single share of total growth, between 23.74 and 25.29 percent. The authors interpret this as evidence that infill saturation occurs between 2 and 4 kilometers of the core, while leapfrog and edge-expansion processes dominate between 6 and 10 kilometers, especially around the larger institutions and the Industrial Model Township developed by HSIIDC along National Highway 9.
Complementary landscape metrics corroborated this reading. Edge length rose steadily in seven of the eight sectors, with the largest absolute gains in the northern and eastern corridors, while the Largest Patch Index increased or remained near saturation above 90 percent in the northern, northeastern, eastern and southeastern sectors, indicating progressive dominance by a single contiguous urban core. Mean patch area accelerated sharply after 2010, most markedly in the southeastern and eastern sectors, consistent with the coalescence of previously discrete patches. In parallel, edge density and patch density declined across all directions, the steepest reductions occurring in the southern sector, and the number of patches fell correspondingly, with the most rapid loss in the southeast, from 40 to 14. Landscape division and splitting indices decreased monotonically, falling below 0.2 and 1.5 respectively in most sectors by 2020, signalling a measurable reduction in fragmentation and a corresponding rise in the contiguity of the built-up fabric.
To move beyond configuration and capture the temporal ordering of change, the team applied Principal Component Analysis to the multicollinear set of landscape metrics, standardized across distance and directional strata. Two retained components explained 86.01 percent of the variance in the direction-wise analysis and 92.35 percent in the distance-wise analysis, with Kaiser-Meyer-Olkin values of 0.656 and 0.732 respectively confirming sampling adequacy. Projecting successive yearly observations onto the two-dimensional component space yielded trajectory metrics: total path length, net displacement, straightness and step lengths between consecutive intervals. The largest cumulative multivariate shifts occurred at 2 kilometers, with a total length of 2.26, and at 8 kilometers, with 2.13, reflecting terminal infilling of the core and active fringe coalescence respectively, while the 4 and 6 kilometer rings showed comparatively short paths indicative of a more stable, mid-transition configuration. All trajectories were strongly directional, with straightness indices ranging from 0.74 to 0.99, demonstrating that change was dominated by a consistent driver rather than random fluctuation.
Direction-wise trajectories sharpened the picture further. The northern, eastern and southeastern sectors traced the longest, most displaced paths in component space, with total lengths between 3.30 and 4.10, indicating the most complete transition from fragmented to coalesced form, while the western, southwestern and northwestern sectors followed short, tortuous, low-straightness paths, signalling that their considerable built-up gains were achieved largely through in-place densification and infilling rather than radial advance. Notably, the single largest multivariate jump clustered in the 2010 to 2015 window, coinciding with Rohtak’s elevation to Municipal Corporation status in 2010 and the attendant 240 percent enlargement of its municipal boundary. The authors suggest that this discrete administrative shock may be temporally associated with an accelerated transition from diffusion toward greater morphological contiguity, though they caution that the observational design cannot establish causation.
Read through the diffusion-coalescence framework of urban growth, the findings resolve Rohtak’s two decades into three phases: a fragmented phase from 2000 to 2010, when numerous small patches emerged through opportunistic development as surrounding villages were gradually engulfed; a transitional phase from 2010 to 2015, when patches began to merge as mean patch area and the Largest Patch Index rose and fragmentation indices fell; and a coalescence phase from 2015 to 2020, when contiguous large patches dominated and edge and patch densities fell, producing a classic consolidation pattern guided by National Highway 9 integration and the Rohtak Master Plan 2031. The directional bias itself, the authors argue, is endogenously generated rather than imposed by geography, since the city sits on unconstrained flat terrain. Instead, the growth engines are identifiable anchors: Maharshi Dayananda University, the Indian Institute of Management Rohtak and the Pt. B.D. Sharma University of Health Sciences, which generate sustained demand for housing and services, reinforced by the Industrial Model Township and radial highway connectivity to Delhi. The muted eastern corridor, lacking equivalent pull-factors and possibly zoned for agriculture or future-use reserves, is earmarked by a proposed eastern industrial township for later-phase growth. Overall, Rohtak exemplifies a ripple-effect urbanisation model, shifting from a monocentric core to polycentric, corridor-based growth at the edges, and the integrated distance-direction-trajectory framework the researchers developed, requiring only multi-date classified built-up layers and a defined urban core, is readily transferable to the secondary cities of South and Southeast Asia, Sub-Saharan Africa and Latin America, where an estimated 90 percent of future urban growth will occur and where planning still relies heavily on aggregate-area assessments.
Subject of Research: Assessing urban development trajectories using landscape expansion metrics and multivariate statistical approaches: evidences from rohtak city, NCR, India
Article Title: Assessing urban development trajectories using landscape expansion metrics and multivariate statistical approaches: evidences from rohtak city, NCR, India
Article References: Bhushan, B., Singh, S., Mandal, S., Sharma, V., Kumar, P., Fülöp, A., & Elhdad, S. (2026). Assessing urban development trajectories using landscape expansion metrics and multivariate statistical approaches: evidences from rohtak city, NCR, India. Frontiers in Remote Sensing, 7, Article 1912607. https://doi.org/10.3389/frsen.2026.1912607
Image Credits: AI Generated
DOI: 10.3389/frsen.2026.1912607
Keywords: Assessing, urban, development, trajectories, landscape, expansion, metrics, multivariate, statistical, approaches, evidences, rohtak
Cite Scienmag News
Russell Cooper. (October 15, 2026). Assessing urban development trajectories using landscape expansion metrics and multivariate statistical approaches: evidences from rohtak city, NCR, India. Scienmag. https://scienmag.com/assessing-urban-development-trajectories-using-landscape-expansion-metrics-and-multivariate-statistical-approaches-evidences-from-rohtak-city-ncr-india/
Russell Cooper. "Assessing urban development trajectories using landscape expansion metrics and multivariate statistical approaches: evidences from rohtak city, NCR, India." Scienmag, 15 October 2026, https://scienmag.com/assessing-urban-development-trajectories-using-landscape-expansion-metrics-and-multivariate-statistical-approaches-evidences-from-rohtak-city-ncr-india/. Accessed 15 October 2026.
Russell Cooper. "Assessing urban development trajectories using landscape expansion metrics and multivariate statistical approaches: evidences from rohtak city, NCR, India." Scienmag. October 15, 2026. https://scienmag.com/assessing-urban-development-trajectories-using-landscape-expansion-metrics-and-multivariate-statistical-approaches-evidences-from-rohtak-city-ncr-india/


