


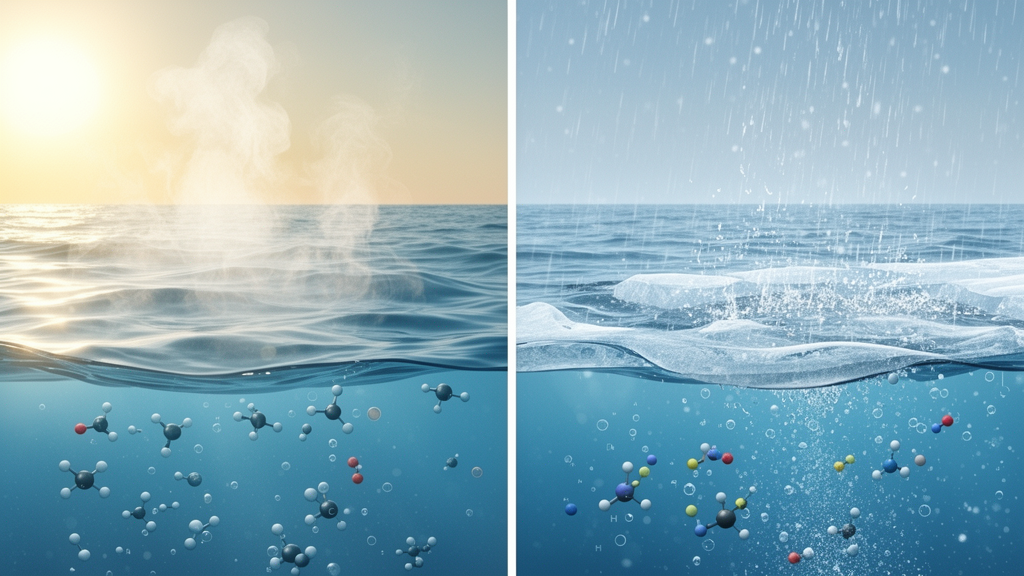
A quality-controlled archive of nearly 9,000 surface-ocean isotope measurements shows that seasonal changes in the relationship between seawater isotopes and salinity are usually smaller than the large differences among ocean regions. The observational study focused on δ18O, δ2H and deuterium excess, or d-excess, in 20 subregions of the surface Atlantic Ocean and southwestern Indian Ocean. Coherent seasonal signals were detected in the North Atlantic subpolar gyre and central equatorial Atlantic, while in most other regions the variations remained within sampling noise and representativeness errors. An independent, nearly monthly time series at the Bermuda Atlantic Time-series Study site also revealed a clear annual cycle in salinity, δ18O and δ2H, with weaker evidence for a cycle in d-excess and apparent interannual isotope variability that did not closely follow salinity.
The analysis primarily used the CISE-LOCEAN database, whose stable-isotope samples have been analyzed at the LOCEAN isotope laboratory since about 1998. Associated salinity measurements generally came from calibrated CTD casts or discrete samples measured with a salinometer. The database combines isotope-ratio mass spectrometry with cavity ring-down spectroscopy, or CRDS; about 80% of its surface measurements were produced with CRDS, allowing the researchers to examine δ2H and d-excess in addition to δ18O. Quality-control procedures included reference-material insertions, duplicate analyses and flags for samples that may have evaporated during prolonged storage. The investigators also assessed possible offsets among analytical methods and excluded a group of 1998–1999 equatorial δ18O measurements with an estimated negative offset of about 0.15‰ from the relevant seasonal analysis.
Surface water is nearly conservative with respect to chemical and biological processes apart from fractionation during phase changes and meteoric inputs, making isotope-salinity relationships useful for tracing freshwater sources and water masses. Evaporation generally increases both salinity and the abundance of heavy isotopes, while precipitation and other freshwater inputs often lower salinity and are depleted in heavy isotopes. The research therefore fitted linear relationships between each isotope variable and practical salinity within oceanographic boxes, restricting salinity ranges to avoid the most strongly freshened waters directly affected by rivers, heavy rainfall or major sea-ice melt. Samples were grouped into four three-month seasons. To reduce the influence of uneven seasonal sampling on annual estimates, the authors averaged the seasonal regression coefficients rather than fitting one line to all available observations.
The resulting regional slopes varied substantially. For δ18O and δ2H, the isotope-salinity slopes were generally largest in the northern and western North Atlantic subpolar gyre and in the southern Indian Ocean, and smallest near the equator. In the tropical and subtropical Atlantic, slopes also tended to be lower in the western ocean than in the east. The annual regional relationships commonly explained about 40% to 70% of the observed variability, although d-excess at high latitudes and δ18O and δ2H near the equator were exceptions. In the latter setting, explained variance was often only 20% to 30%, with correlations marginally significant at p=0.02 or p=0.05. The d-excess regression explained about 40% of variance in equatorial Atlantic boxes and had a Pearson correlation of 0.63, significant at p=0.01. These spatial differences are compatible with varying contributions from evaporation, precipitation, river discharge, sea-ice melt, upwelling and the advection of isotopically distinct water masses.
The clearest seasonal departures from annual relationships appeared in the North Atlantic subpolar gyre, where repeated sampling around Iceland and the Irminger Sea provided comparatively dense coverage. In the best-sampled Irminger Sea box, salinity relationships explained a substantial share of the variation in δ18O and δ2H, with mean Pearson correlations of 0.69 and 0.67 across the four seasons; all seasonal correlations were significantly different from zero at p=0.01. The corresponding mean correlation for d-excess was only 0.35. Winter observations showed a slightly steeper isotope-salinity slope and more negative intercepts, especially in the western gyre, while spring d-excess values at a given salinity shifted toward lower values. The researchers linked these patterns to seasonal changes in Arctic-origin freshwater and the formation and melting of sea ice, but the data do not isolate the responsible processes.
That qualification is important because a simple sea-ice explanation does not account for every observed feature. Brine release can raise salinity while leaving the isotopic composition of the remaining liquid seawater nearly unchanged, allowing samples to move along an established isotope-salinity line. The spring shift in d-excess runs in the opposite direction from that simple expectation, and seasonal differences in d-excess slopes generally remained within their error bars, estimated at about 0.15‰ per practical salinity unit in the well-sampled gyre regions. Active winter air-sea exchange, vertical mixing and transport of freshwater could also affect the relationships. The study presents these as possible influences that would require isotope-enabled modeling rather than as mechanisms demonstrated by the observations.
The central equatorial Atlantic produced a contrasting seasonal structure. Neighboring boxes at 5°–12° N and 5° S–5° N contained cycles in salinity, δ18O, δ2H and d-excess with different timing, demonstrating that the seasonal signal north of the equator was not simply a repetition of the cycle immediately to the south. The equatorial box had a smaller apparent amplitude, and its estimated seasonal variance decreased after an adjustment for uneven spatial sampling. That correction reduced the standard deviation of the salinity cycle from 0.27 to 0.15 and the d-excess cycle from 0.19 to 0.14‰; for δ18O it fell from 0.027 to 0.015‰, and for δ2H from 0.19 to 0.16‰. After correction, δ18O remained correlated with salinity at the 90% confidence level, with r=0.71, whereas δ2H at r=0.60 and d-excess at r=−0.46 did not.
The equatorial timing is associated with the seasonal movement of the Intertropical Convergence Zone and the annual cycle of equatorial upwelling. The convergence zone is farthest south during January–March, while upwelling begins around May as the zone shifts northward. The eastward North Equatorial Counter Current develops later, during July–August, and can transport Amazon plume water toward the central Atlantic. Seasonal differences in δ18O, δ2H and d-excess north and south of the equator were therefore associated with changing rainfall, upwelling, current transport and continental freshwater influence. The analysis does not quantify the contribution of each process or establish a causal partition. Sampling bias remains an additional concern: in the 5° S–5° N box, the spatial standard deviation of monthly climatological salinity often exceeded 0.1, and some monthly isotope estimates had standard errors as high as 0.10‰ for δ18O, with typical errors about six times larger for δ2H and four times larger for d-excess.
Samples collected almost monthly from 2015 through 2022 at the Bermuda Atlantic Time-series Study site, located at 31°50′ N, 64°10′ W, provided a rare check on seasonality without the large spatial-representativeness problem affecting irregular ship-based sampling. The resulting series indicated a defined annual cycle in salinity, δ18O and δ2H, with lower isotope values during June–August, while d-excess was less clearly resolved because of the smaller number of observations and greater measurement uncertainty. Removing the estimated monthly cycle substantially reduced the variance in the isotope records. Even after applying a one-year running mean, however, standard errors averaged 0.026 in practical salinity and 0.018, 0.13 and 0.06‰ for δ18O, δ2H and d-excess, respectively. Storage in imperfectly sealed plastic bottles, possible evaporation, instrument reproducibility problems and monthly sample sizes of only about five or six limited the precision of the record.
The Bermuda observations also suggested that interannual isotope variability is not simply a mirror of salinity. Higher-than-normal δ18O and δ2H occurred around 2017–2018, whereas lower values appeared in 2019 and 2021, and some low-salinity periods were not accompanied by correspondingly low isotope values. The pattern partly resembled the North Atlantic Oscillation: winters with a positive index tended toward higher δ18O and δ2H and lower d-excess, while the more negative index in 2021 was associated with the opposite pattern. This was an association in a short, noisy record, not a demonstrated causal relationship. The authors state that a longer time series, smaller analytical errors and dedicated simulations would be needed to distinguish hydrological-cycle changes from effects of ocean circulation, surface stratification and upwelling. Their overall conclusion is that seasonal isotope-salinity variability is generally modest beside spatial variability, but meaningful in dynamically active regions such as the subpolar gyre and equatorial Atlantic. Denser near-surface observations, sustained time series and careful intercomparison among laboratories are therefore needed to improve understanding of how evaporation, precipitation, sea ice, rivers, glaciers and circulation shape upper-ocean isotope composition.
Subject of Research: Seasonal variation in surface-ocean stable isotopes and their relationships with salinity in the Atlantic and southwestern Indian Ocean
Article Title: Seasonal cycle in surface seawater isotopic composition
Article References: Reverdin, G., Waelbroeck, C., Goeme, L., Voelker, A. H. L., & Steen-Larsen, H. C. (2026). Seasonal cycle in surface seawater isotopic composition. Ocean Science, 22(5), 3225-3243. https://doi.org/10.5194/os-22-3225-2026
Image Credits: AI Generated
Keywords: surface seawater, oxygen-18, deuterium, deuterium excess, ocean salinity, North Atlantic, equatorial Atlantic, Indian Ocean, sea-ice melt, ocean upwelling, Seasonal, cycle
Cite Scienmag News
Violet Maxwell. (October 20, 2026). Seasonal cycle in surface seawater isotopic composition. Scienmag. https://scienmag.com/seasonal-cycle-in-surface-seawater-isotopic-composition/
Violet Maxwell. "Seasonal cycle in surface seawater isotopic composition." Scienmag, 20 October 2026, https://scienmag.com/seasonal-cycle-in-surface-seawater-isotopic-composition/. Accessed 20 October 2026.
Violet Maxwell. "Seasonal cycle in surface seawater isotopic composition." Scienmag. October 20, 2026. https://scienmag.com/seasonal-cycle-in-surface-seawater-isotopic-composition/


