


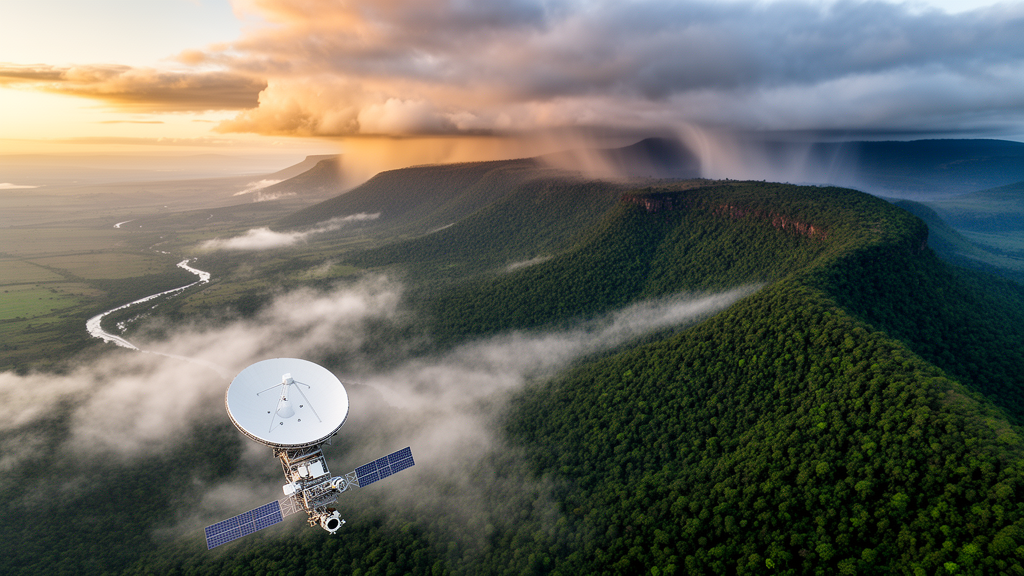
High above the farms and cities of central Kenya, Mount Kenya functions as the country’s most important water tower, feeding rivers that supply more than forty percent of the nation’s freshwater for drinking, irrigation, and hydroelectric power. Yet the rain gauges and stream gauges that should track this precious resource are few, unevenly scattered, and often incomplete. A new study published in PLOS Water shows that the satellite and model-based datasets increasingly used to fill such gaps carry serious, systematic biases in this mountainous region, and that a machine learning technique can correct those errors with remarkable precision, transforming unreliable data into tools fit for real-world water management.
The research, led by Felicia Yeboah of the University of Ghana with colleagues at the International Water Management Institute and Kenya’s State Department for Irrigation, focused on the Central Highlands, a 52,064-square-kilometer region spanning eleven counties around Mount Kenya. The team evaluated five widely used satellite precipitation products, CHIRPS, PERSIANN-CCS, PERSIANN-PDIR, TAMSAT, and MSWEP, against ground observations from eight rain gauge stations between 2012 and 2021. They also tested a model-derived river discharge dataset, VegDischarge, which simulates streamflow across more than 650,000 African river segments by routing runoff from the VegET agro-hydrologic model through the mizuRoute routing framework.
The validation relied on a battery of standard hydrological statistics. Root mean square error, or RMSE, quantifies the magnitude of deviations; the Nash-Sutcliffe Efficiency, or NSE, measures predictive skill relative to simply using the observed mean; the correlation coefficient captures how well timing and variability align; and relative mean bias reveals systematic over- or underestimation. Categorical metrics, the probability of detection and the false alarm ratio, assessed how well each product identified rainy days. The verdict was sobering: no product was uniformly reliable, and every one of them overestimated rainfall at most stations, a pattern the authors attribute to orographic processes that satellite algorithms struggle to resolve in complex terrain.
Still, two products stood out. CHIRPS achieved monthly RMSE values between 34.85 and 134.26 millimeters, NSE values from minus 0.94 to 0.44, and correlations of 0.52 to 0.87, while MSWEP recorded RMSE of 24.17 to 125.66 millimeters, NSE from minus 0.91 to 0.65, and correlations of 0.45 to 0.84. The two excelled in complementary ways: MSWEP generally reduced magnitude errors, whereas CHIRPS captured temporal variability more faithfully, posting stronger correlations at five of the eight stations. TAMSAT and the PERSIANN variants fared considerably worse, with TAMSAT producing NSE values as low as minus 4.56 at Munyaka during the long rains and RMSE figures approaching 1,000 millimeters at the annual scale.
Performance also shifted with season and elevation, a finding with direct operational consequences. During the March-to-May long rains, MSWEP was the most dependable product; during the October-to-December short rains, PERSIANN-PDIR took the lead; and across full years, CHIRPS proved most consistent. At wet, high-elevation sites such as Naro Moru and Nyahururu, all products degraded sharply, while in drier, semi-arid locations like Archer’s Post and Wamba they aligned far better with gauges. The lesson, the authors stress, is that product selection must be matched to the timescale, season, and location of the intended application, because no single dataset reproduces rainfall magnitudes reliably everywhere.
The discharge side of the analysis told a similar story of promise undermined by bias. VegDischarge successfully reproduced the seasonal rhythm of river flow, with peaks in April and May and a secondary rise in November tracking the bimodal rainfall regime. But the quantitative agreement was weak, with NSE values ranging from minus 2.28 to just 0.23 and correlations between 0.46 and 0.71. The model underestimated peak flows at the high-yielding Naro Moru stations, overestimated discharge elsewhere, and systematically underrepresented low flows across nearly all sites, a shortcoming traced to the underlying VegET model’s tendency to simulate baseflow at or near zero.
To rescue these datasets, the team applied four bias correction techniques: linear scaling, quantile mapping, the delta method, and a Random Forest machine learning model. The three statistical approaches improved matters to varying degrees, but the Random Forest method was in a class of its own. Trained on the relationship between satellite estimates and gauge observations, the ensemble of decision trees captured the complex, nonlinear error structures that simple scaling and distribution-based adjustments could not. After correction, monthly precipitation NSE rose to a consistently positive 0.85 to 0.95 across all eight stations, correlations climbed to 0.93 to 0.98, and RMSE was roughly halved at most sites, falling to between 9.05 and 46.23 millimeters.
The same technique worked equally dramatic improvements on streamflow. Corrected discharge reached NSE values of 0.80 to 0.88 and correlations of 0.92 to 0.95 at five of the six gauging stations, while preserving the variance structure of the hydrograph rather than smoothing it away. One station, A5 Naro Moru, exposed a structural limitation: Random Forest predictions are bounded by the range of their training data, so the method could not extrapolate to that catchment’s extreme flood peaks, and linear scaling actually performed better there. The authors note this weakness matters most precisely for flood applications, and they point toward hybrid, physics-informed correction approaches as the next frontier.
The implications extend well beyond Kenya. Sparse observational networks plague much of Africa, where global hydrological products are often adopted without local validation, and errors in rainfall inputs propagate through every downstream model that depends on them. An annual water-balance check lent physical credibility to the corrected datasets, yielding plausible positive storage changes of 2.8 to 8.1 cubic kilometers per year between 2018 and 2021 for this recharge-dominated water tower. For a region where agriculture, biodiversity, and growing urban populations all compete for water, the bias-corrected CHIRPS and VegDischarge datasets offer something previously scarce: defensible, high-accuracy estimates on which allocation decisions and flood planning can credibly rest.
Challenges remain. With only eight rainfall stations and six discharge gauges, the study’s corrections may not generalize to underrepresented peripheral areas, and the transferability of machine learning models across regions, time periods, and hydroclimatic regimes is still unproven. The authors also call for formal uncertainty quantification and for testing the newly released CHIRPS version 3 in similar environments. Even so, the study delivers a clear and consequential message: in data-scarce mountain regions, systematic bias, not random noise, is the dominant error in global hydrological products, and machine learning has matured into an essential tool for turning satellite eyes and model simulations into water management instruments that communities can actually trust.
Subject of Research: Bias correction of satellite precipitation products and model-derived river discharge in Kenya's Central Highlands
Article Title: Toward reliable water resource assessment: Correcting bias in satellite-based rainfall and model-derived discharge in Kenya’s Central Highlands
Article References: Yeboah, F., Owusu, A., Leh, M., Akpoti, K., Mekonnen, K., Adamseged, E. M., Odera, E., & Velpuri, N. (2026). Toward reliable water resource assessment: Correcting bias in satellite-based rainfall and model-derived discharge in Kenya’s Central Highlands. PLOS Water, 5(9), e0000623. https://doi.org/10.1371/journal.pwat.0000623
Image Credits: AI Generated
DOI: 10.1371/journal.pwat.0000623
Keywords: satellite precipitation, bias correction, machine learning, Random Forest, CHIRPS, MSWEP, VegDischarge, Kenya, Central Highlands, hydrology, streamflow, water resources
Cite Scienmag News
Teresa Odom. (October 8, 2026). Machine Learning Rescues Satellite Rainfall Data in Kenya’s Vital Water Tower. Scienmag. https://scienmag.com/machine-learning-rescues-satellite-rainfall-data-in-kenyas-vital-water-tower/
Teresa Odom. "Machine Learning Rescues Satellite Rainfall Data in Kenya’s Vital Water Tower." Scienmag, 8 October 2026, https://scienmag.com/machine-learning-rescues-satellite-rainfall-data-in-kenyas-vital-water-tower/. Accessed 8 October 2026.
Teresa Odom. "Machine Learning Rescues Satellite Rainfall Data in Kenya’s Vital Water Tower." Scienmag. October 8, 2026. https://scienmag.com/machine-learning-rescues-satellite-rainfall-data-in-kenyas-vital-water-tower/


