


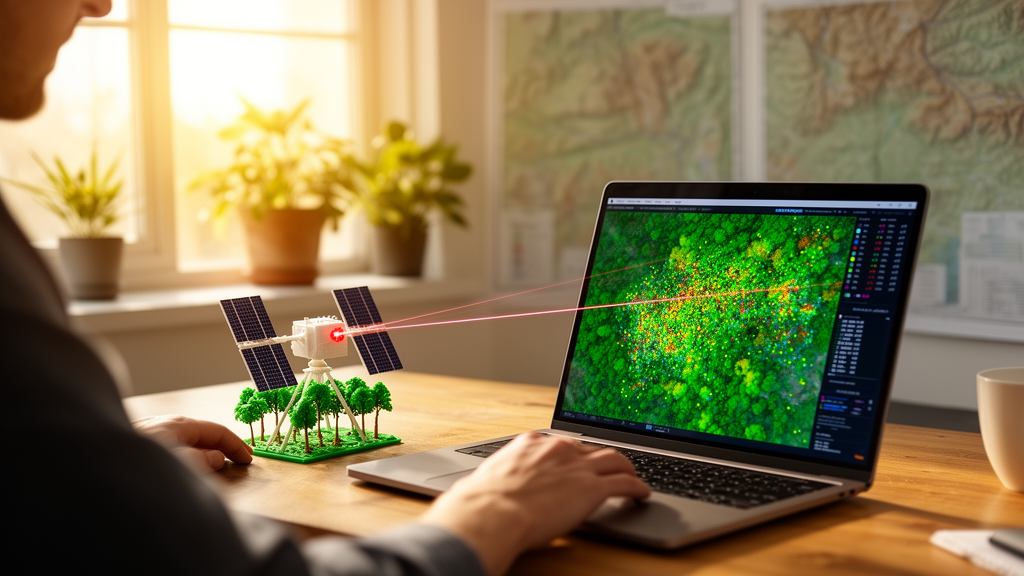
Forests store an enormous share of the planet’s carbon, and the three-dimensional architecture of their canopies determines how much of that carbon they can hold, how much habitat they provide, and how they respond to disturbance. For decades, measuring that vertical structure meant costly field campaigns or airborne laser surveys that covered only small, discontinuous patches of land. NASA’s Global Ecosystem Dynamics Investigation, known as GEDI, changed the equation by firing billions of laser pulses at forests from the International Space Station, producing near-global, high-resolution three-dimensional snapshots of vegetation between 51.6 degrees north and south of the equator. Now, a team of researchers has removed one of the last practical barriers between that torrent of spaceborne data and the ecologists, foresters, and conservationists who need it.
In a study published in Earth Science Informatics, Alexander Cotrina-Sanchez and Michele Torresani of the Free University of Bozen-Bolzano, together with Leonel Corado of the Universidade de Évora, present GEDIMetrics, an open-source plugin for the widely used geographic information system QGIS. The tool integrates the entire GEDI processing chain, from discovering and downloading raw data files to filtering, clipping, and fusing four complementary data products into a single analysis-ready dataset, all through a graphical interface that requires no programming. The plugin is freely available through the official QGIS Plugin Repository and on GitHub under the GNU General Public License.
The technical challenge the plugin addresses is deceptively simple to describe but notoriously tedious in practice. GEDI’s laser footprints, roughly 25 meters in diameter and spaced about 60 meters apart along the satellite’s track, capture the vertical distribution of returned laser energy. From these waveforms, NASA derives several distinct products: Level 2A provides canopy height and ground elevation metrics, Level 2B characterizes vertical canopy structure including canopy cover, plant area index, and foliage height diversity, Level 4A delivers aboveground biomass density estimates from globally calibrated models, and Level 4C offers the Waveform Structural Complexity Index, a machine-learning-derived measure of three-dimensional canopy complexity. Each product, however, is distributed as independent HDF5 files organized by laser beam, and the products must be aligned using a unique identifier called the shot number before any joint analysis becomes possible.
Existing tools each solved only fragments of this puzzle. NASA’s EarthData Search portal handles discovery and download but performs no subsetting, filtering, or cross-product integration. Programming libraries such as rGEDI and pyGEDI offer flexible scripted processing but demand coding expertise. Command-line frameworks like GEDI-Pipeline introduced automation, yet none provided a graphical workflow suitable for non-programmers, and none supported automated multi-product merging. GEDIMetrics closes that gap with a five-stage pipeline: granule discovery through NASA’s Common Metadata Repository API, authenticated download from EarthData, variable extraction with quality filtering, spatial subsetting to a user-defined region, and footprint-level merging of the selected products, followed by export to standard geospatial formats such as GeoPackage and GeoParquet.
The engineering behind the plugin reflects careful attention to both performance and reproducibility. Spatial filtering proceeds in two stages, beginning with a fast bounding-box pre-filter and followed by precise point-in-polygon clipping using Shapely geometric operations, an approach that substantially reduces processing time for granules covering far more area than the target region. Because data availability can differ across products due to variations in temporal coverage, algorithm convergence, or quality criteria, the merging stage uses Level 2A as the base product and offers configurable join strategies: an inner join retains only footprints present in all selected products, guaranteeing cross-product consistency, while an outer join preserves maximum spatial coverage at the cost of null values. Output files embed metadata recording the full processing configuration, including selected products, temporal range, region geometry, quality thresholds, and plugin version, ensuring that every analysis can be reproduced exactly.
Quality filtering, a critical step for GEDI data, is handled through an intuitive interface. Users can set minimum thresholds for product-specific quality flags, exclude footprints degraded by cloud or atmospheric effects, restrict analysis to land surfaces, and apply a global minimum beam sensitivity threshold, defaulting to 0.90 following criteria established for broad-scale applications. The sensitivity threshold can be raised for particular ecosystems, for example to 0.96 for temperate forests or higher for dense tropical canopies where the laser signal struggles to penetrate to the ground. A logging panel reports the number of granules identified and the estimated data volume before download begins, allowing users to adjust their parameters before committing to lengthy retrievals.
To demonstrate the plugin’s capabilities, the team tested GEDIMetrics across two contrasting forest ecosystems of roughly 100 square kilometers each: a temperate mixed forest in northeastern France and a humid tropical rainforest in the Madre de Dios region of southeastern Peru, an area partially overlapping the Tambopata National Reserve where intact forest faces mounting pressure from illegal gold mining. Using data from March 2019 to April 2023 with default quality settings, the temperate site yielded 96 granules and 5,939 forested footprints, while the tropical site produced only 23 granules and 1,712 footprints, a disparity that reflects the International Space Station’s orbital geometry, which delivers more frequent coverage at mid-latitudes than near the equator.
The case study also revealed striking asymmetries in product-level data availability that cannot be inferred from footprint counts alone. Retention of the Level 2B canopy structure product was moderate at the temperate site, at 60.8 percent of forested footprints, but nearly absent at the tropical site, at just 0.9 percent. The biomass product showed the inverse pattern, with 7.2 percent retention in France versus 87.2 percent in Peru. Despite these differences, the merged datasets painted a coherent ecological picture: the tropical forest exhibited taller canopies, with a 98th-percentile height of 24.05 meters compared to 18.86 meters at the temperate site, higher aboveground biomass density of 157.49 versus 139.51 megagrams per hectare, and greater structural complexity. Most strikingly, footprints inside the Tambopata National Reserve showed consistently taller canopies, 38 percent higher biomass density, and higher structural complexity than those in the surrounding buffer zone, a quantifiable signature of the degradation pressure from gold mining at the reserve’s edges.
At the temperate site, the plugin’s integrated dataset captured seasonal phenology with unexpected clarity. Canopy cover and plant area index rose sharply during the April-to-October vegetative period, consistent with the flush of deciduous foliage, while canopy height remained essentially stable across seasons, confirming that height metrics are largely insensitive to phenological state. The most dramatic seasonal signal appeared in the median height percentile, which jumped from 1.27 meters in the leafless months to 6.36 meters during the growing season, reflecting the increased interception of laser energy by mid-canopy leaves. This ability to distinguish genuine structural change from seasonal foliage dynamics has direct implications for disturbance monitoring and carbon accounting.
The researchers are candid about current limitations. Processing is single-machine and sequential, which can make large regions slow to analyze, and the plugin does not yet correct GEDI’s footprint geolocation uncertainty of roughly 10 meters, though its modular design allows integration with external correction tools. Future development priorities include polygon-level summary statistics, diagnostics quantifying footprint loss at each filtering stage, in-plugin visualization of vertical foliage profiles, and a hybrid local-cloud workflow leveraging NASA’s evolving cloud-native archives. The team also envisions extending the plugin to ICESat-2 canopy height data, which would push coverage beyond GEDI’s latitudinal limits into boreal and high-latitude forests. For now, GEDIMetrics stands as a quietly transformative piece of software: by collapsing a multi-step, script-heavy workflow into a transparent graphical process inside the world’s most widely used open-source GIS, it puts the vertical architecture of the world’s forests within reach of anyone with a computer, a QGIS installation, and a free NASA EarthData account.
Subject of Research: An open-source QGIS plugin for accessing, filtering, and fusing NASA GEDI spaceborne LiDAR forest structure data products
Article Title: GEDIMetrics: a QGIS plugin for accessing and integrating multi-product GEDI spaceborne LiDAR data
Article References: Cotrina-Sanchez, A., Torresani, M., & Corado, L. (2026). GEDIMetrics: a QGIS plugin for accessing and integrating multi-product GEDI spaceborne LiDAR data. Earth Science Informatics, 19(11), Article 205. https://doi.org/10.1007/s12145-026-02254-z
Image Credits: AI Generated
DOI: 10.1007/s12145-026-02254-z
Keywords: GEDI, spaceborne LiDAR, QGIS, forest structure, aboveground biomass, canopy height, remote sensing, open-source software, geospatial data, NASA EarthData, tropical forest, forest carbon
Cite Scienmag News
Violet Maxwell. (October 8, 2026). New QGIS Plugin Brings NASA’s Space Laser Forest Data to Everyone. Scienmag. https://scienmag.com/new-qgis-plugin-brings-nasas-space-laser-forest-data-to-everyone/
Violet Maxwell. "New QGIS Plugin Brings NASA’s Space Laser Forest Data to Everyone." Scienmag, 8 October 2026, https://scienmag.com/new-qgis-plugin-brings-nasas-space-laser-forest-data-to-everyone/. Accessed 8 October 2026.
Violet Maxwell. "New QGIS Plugin Brings NASA’s Space Laser Forest Data to Everyone." Scienmag. October 8, 2026. https://scienmag.com/new-qgis-plugin-brings-nasas-space-laser-forest-data-to-everyone/


